Analyzing Animal Control Field Performance
Personal Project
This dashboard analyzes animal control response performance across four key jurisdictions in East Baton Rouge Parish, focusing on response times, officer workloads, and equipment utilization.
Key Insights
🐾 The average response time (time it takes for an officer to arrive on the scene) is 65 minutes.🐾 Central is the slowest of the four jurisdictions, especially in call handling.
🐾 Most delays are seen for incidents reported in the early morning hours.
🐾 Longer delays towards the end of the week and the end of the workday.
🐾 The most used equipment corresponds with the top-performing officers. Most officers tend to stick to one equipment throughout their career.
Recommendations
🐾 Improve dispatch efficiency in Central by investigating call routing, call taker workload, or system lags.🐾 Re-evaluate staffing during early morning hours and assign patrol units closer to known morning hotspots.
🐾 Investigate and optimize Friday and 4 pm shifts. Consider adjusting shift overlaps and transitions.
🐾 Rotate overburdened units out of the busiest zones or high-performing officers to reduce breakdowns and maintenance costs.
🐾 Implement regular equipment performance reviews to identify performance trends early.
Credits
The dataset came from Open Data Baton Rouge.Analyzing New York City Rat Sightings
Personal Project
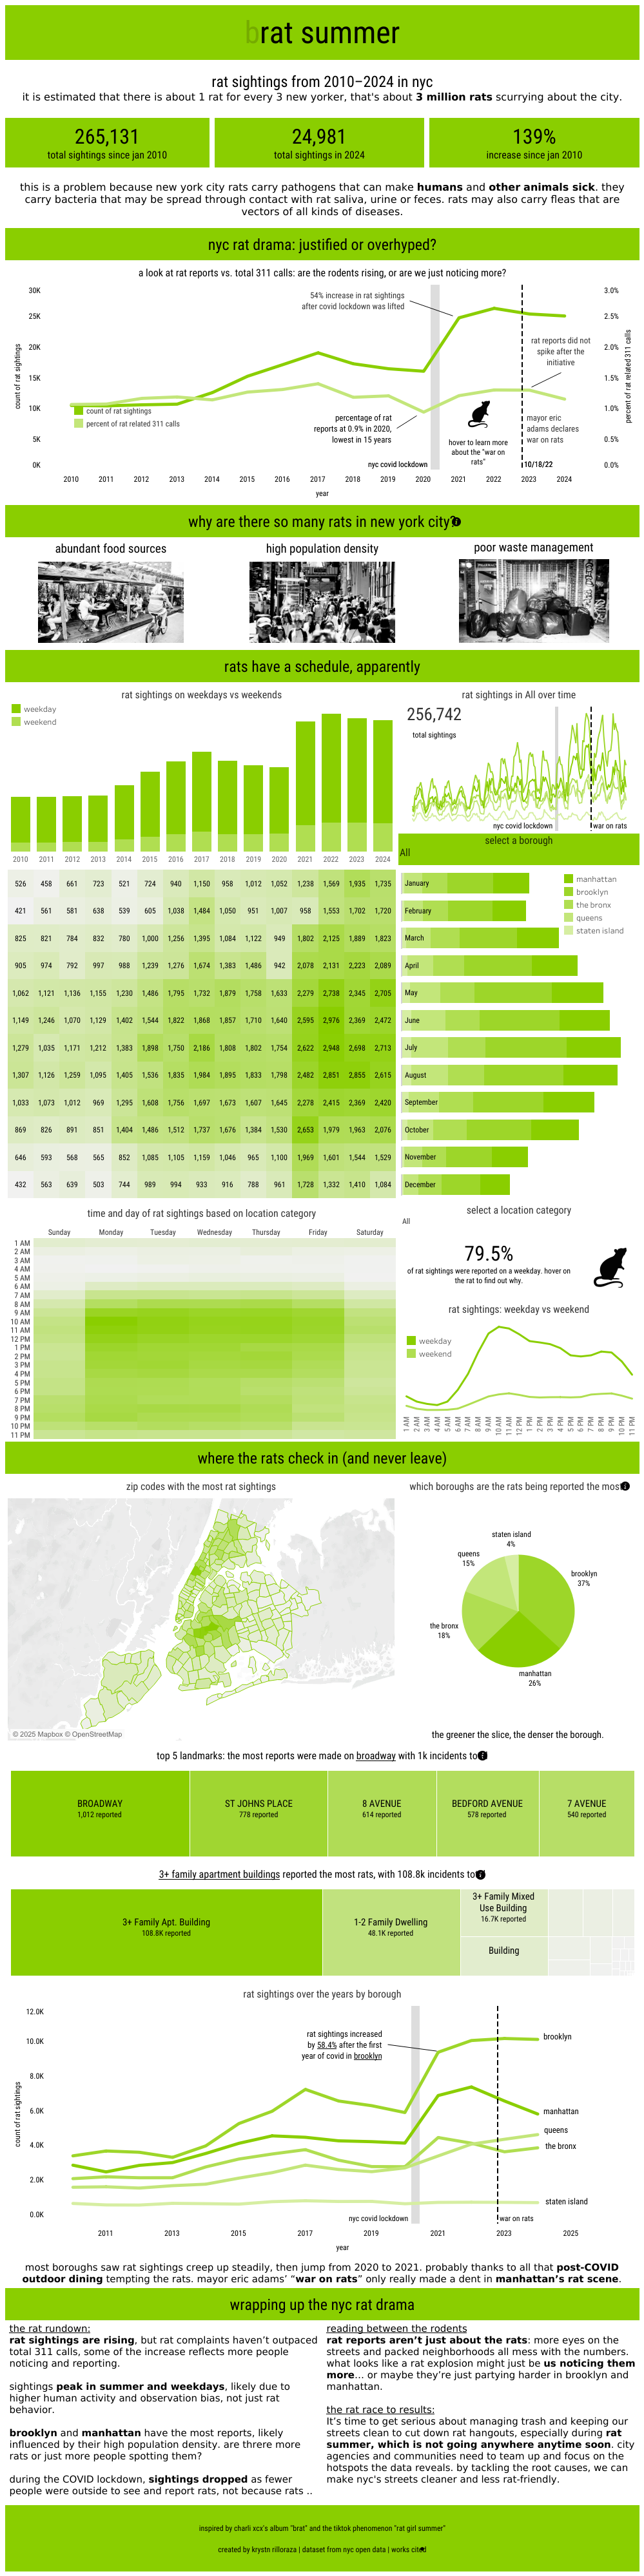
The design of this dashboard was inspired by Charli XCX's hit album "brat" and the TikTok phenomenon "rat girl summer", because that is the kind of energy these New York City rats are giving! (Also because I love that album and I'm chronically online, so I had a lot of fun with this one)
Key Insights
🍏 Rat sightings are rising, but rat complaints haven't outpaced total 311 calls🍏 Sightings peak in the summer and on weekdays, likely due to higher human activity and observation bias, not rat behavior.
🍏 Brooklyn and Manhattan have the most reports, likely influenced by their high population density. But are there more rats or just more people spotting them?
🍏 The majority of rats are being reported near residential buildings. NYC residents probably care more about seeing rats near their homes.
🍏 During the COVID lockdown, sightings dropped as fewer people were outside to see and report rats, not because rats disappeared after lockdown. Increased outdoor dining and street activity likely boosted both rat presence and sightings.
Mayor Eric Adams declared "war on rats" in 2022; he enacted policies and many initiatives to mitigate the number of rats in New York City, but the data shows that... It's not really working. With only a 1% decrease in sightings since his announcement, rat summer isn't going anywhere for a while.
Recommendations
🍏 Target sanitation efforts by season and borough. Sightings spike in the summer and in denser boroughs. Prioritize proactive trash collection, rat-proofing, and inspections in these areas during warmer months.🍏 Focus on hotspots near residential buildings and landmarks. Since the majority of sightings occur near residential buildings and landmarks, deploying more rodent control infrastructure in these zones can improve rat sightings.
🍏 Design better public infrastructure for trash. NYC's aging infrastructure struggles with its waste volume. Pilot programs with sealed bins, compost pickup, or neighborhood clean-up campaigns could help reduce food access for rats in problem zones.
Credits
The dataset came from NYC Open Data.Marketing Campaign Analysis
Analyzing Campaign Strategy for a Global Telecommunications Company
Fellowship Capstone Project


︎︎︎Github
The Team
Location Analyst - Ramon QuintoAudience Analyst - Kabelo Muhammad
Creative Analyst - Cindy Celedonio
Inventory Analyst - Krys Rilloraza
Objective
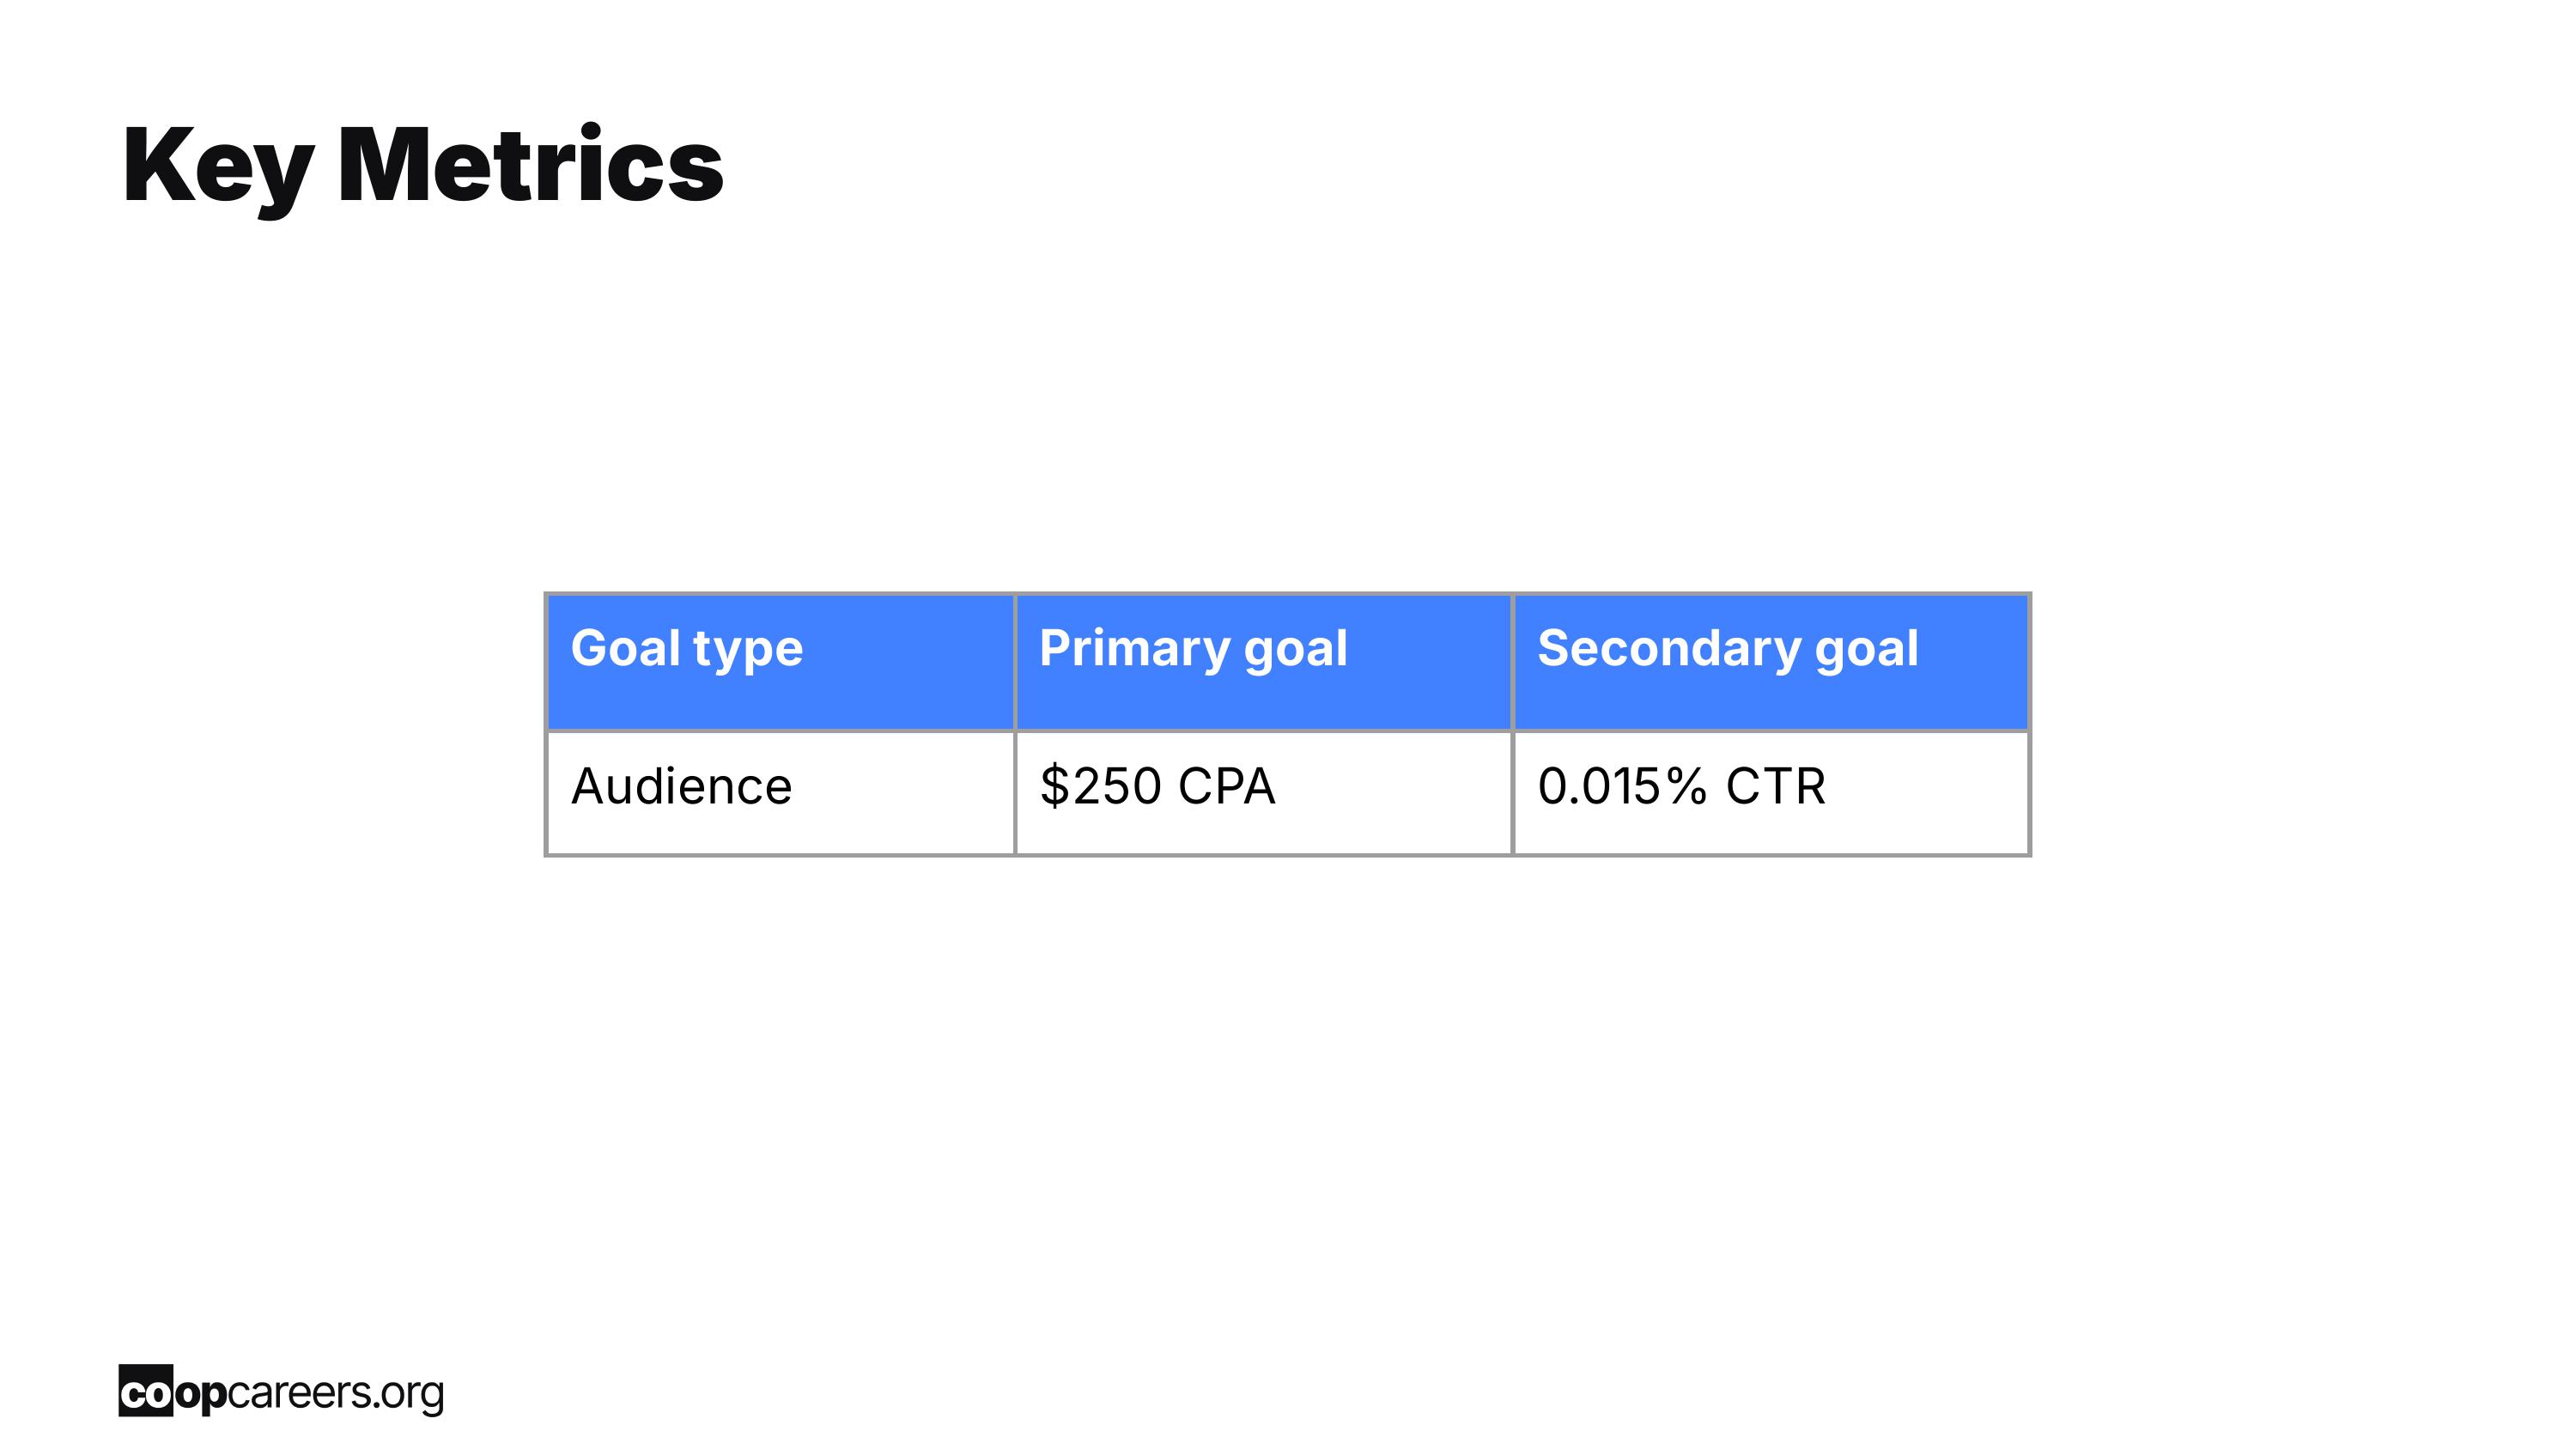
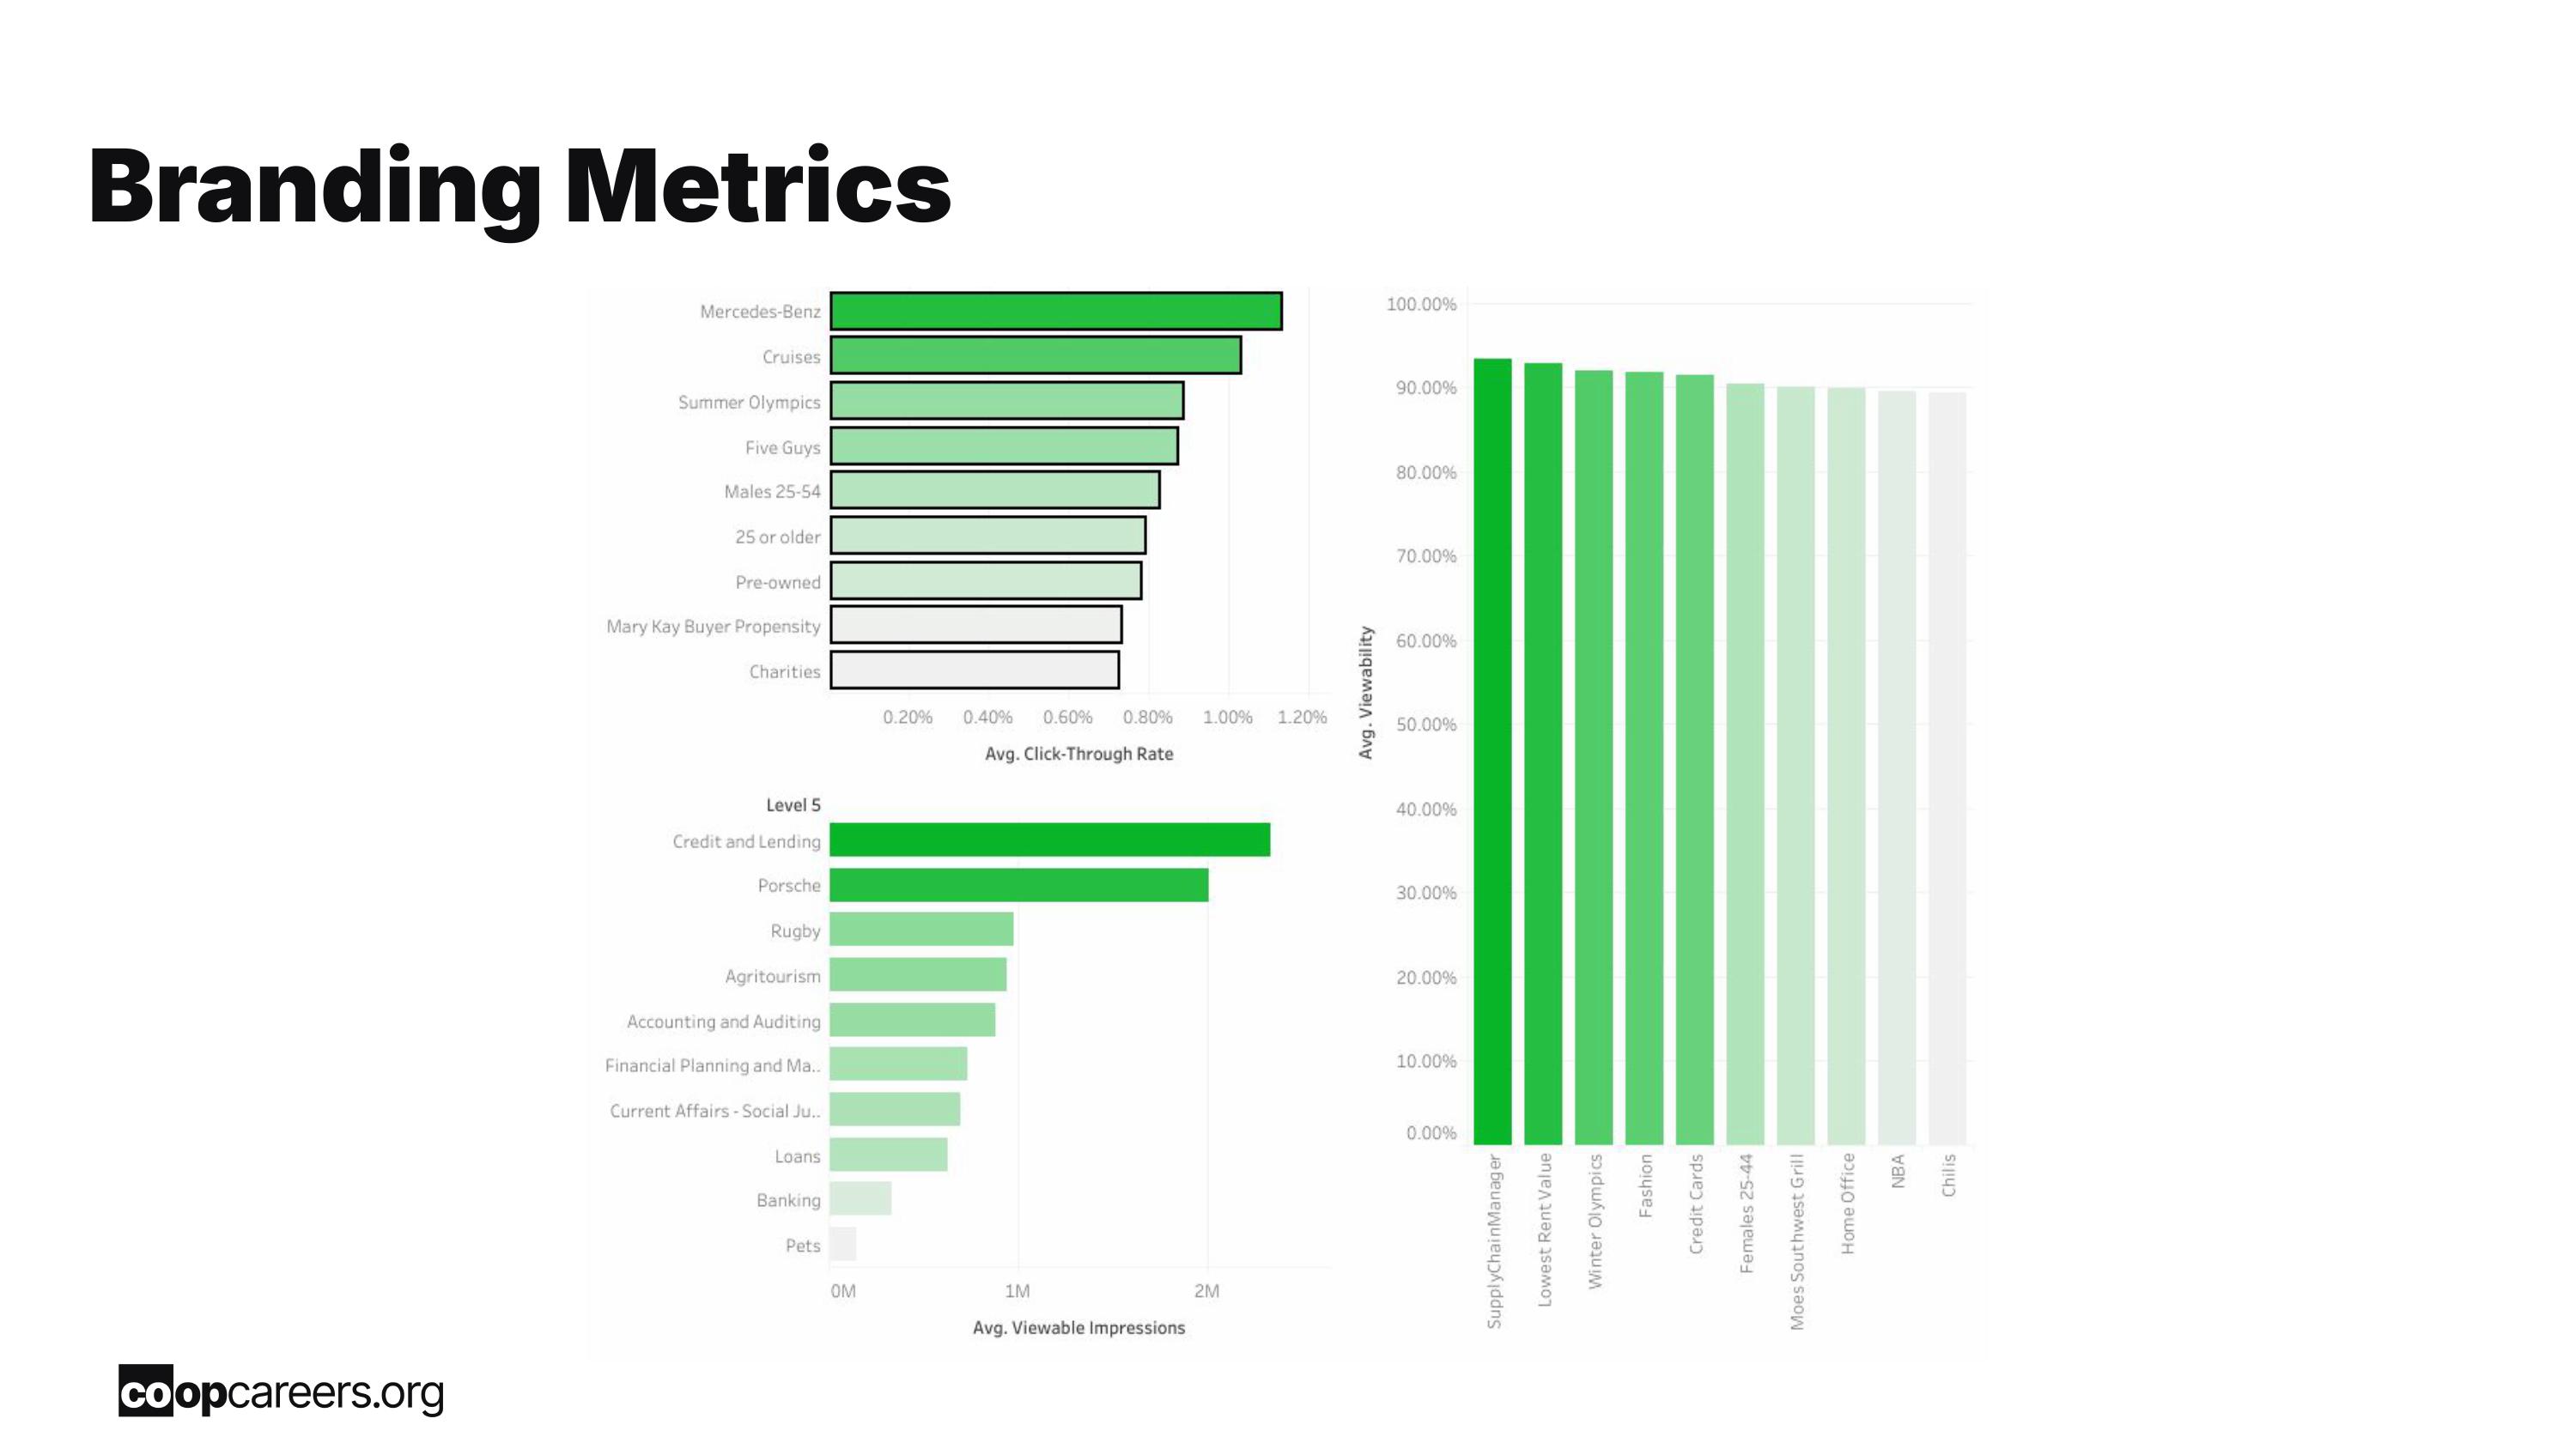
Our team’s campaign analysis for a global telecommunications company focused primarily on making recommendations based on KPIs in performance and branding metrics to recommend actionable suggestions to improve performance, along with a plan for implementing those recommendations.Location Analysis
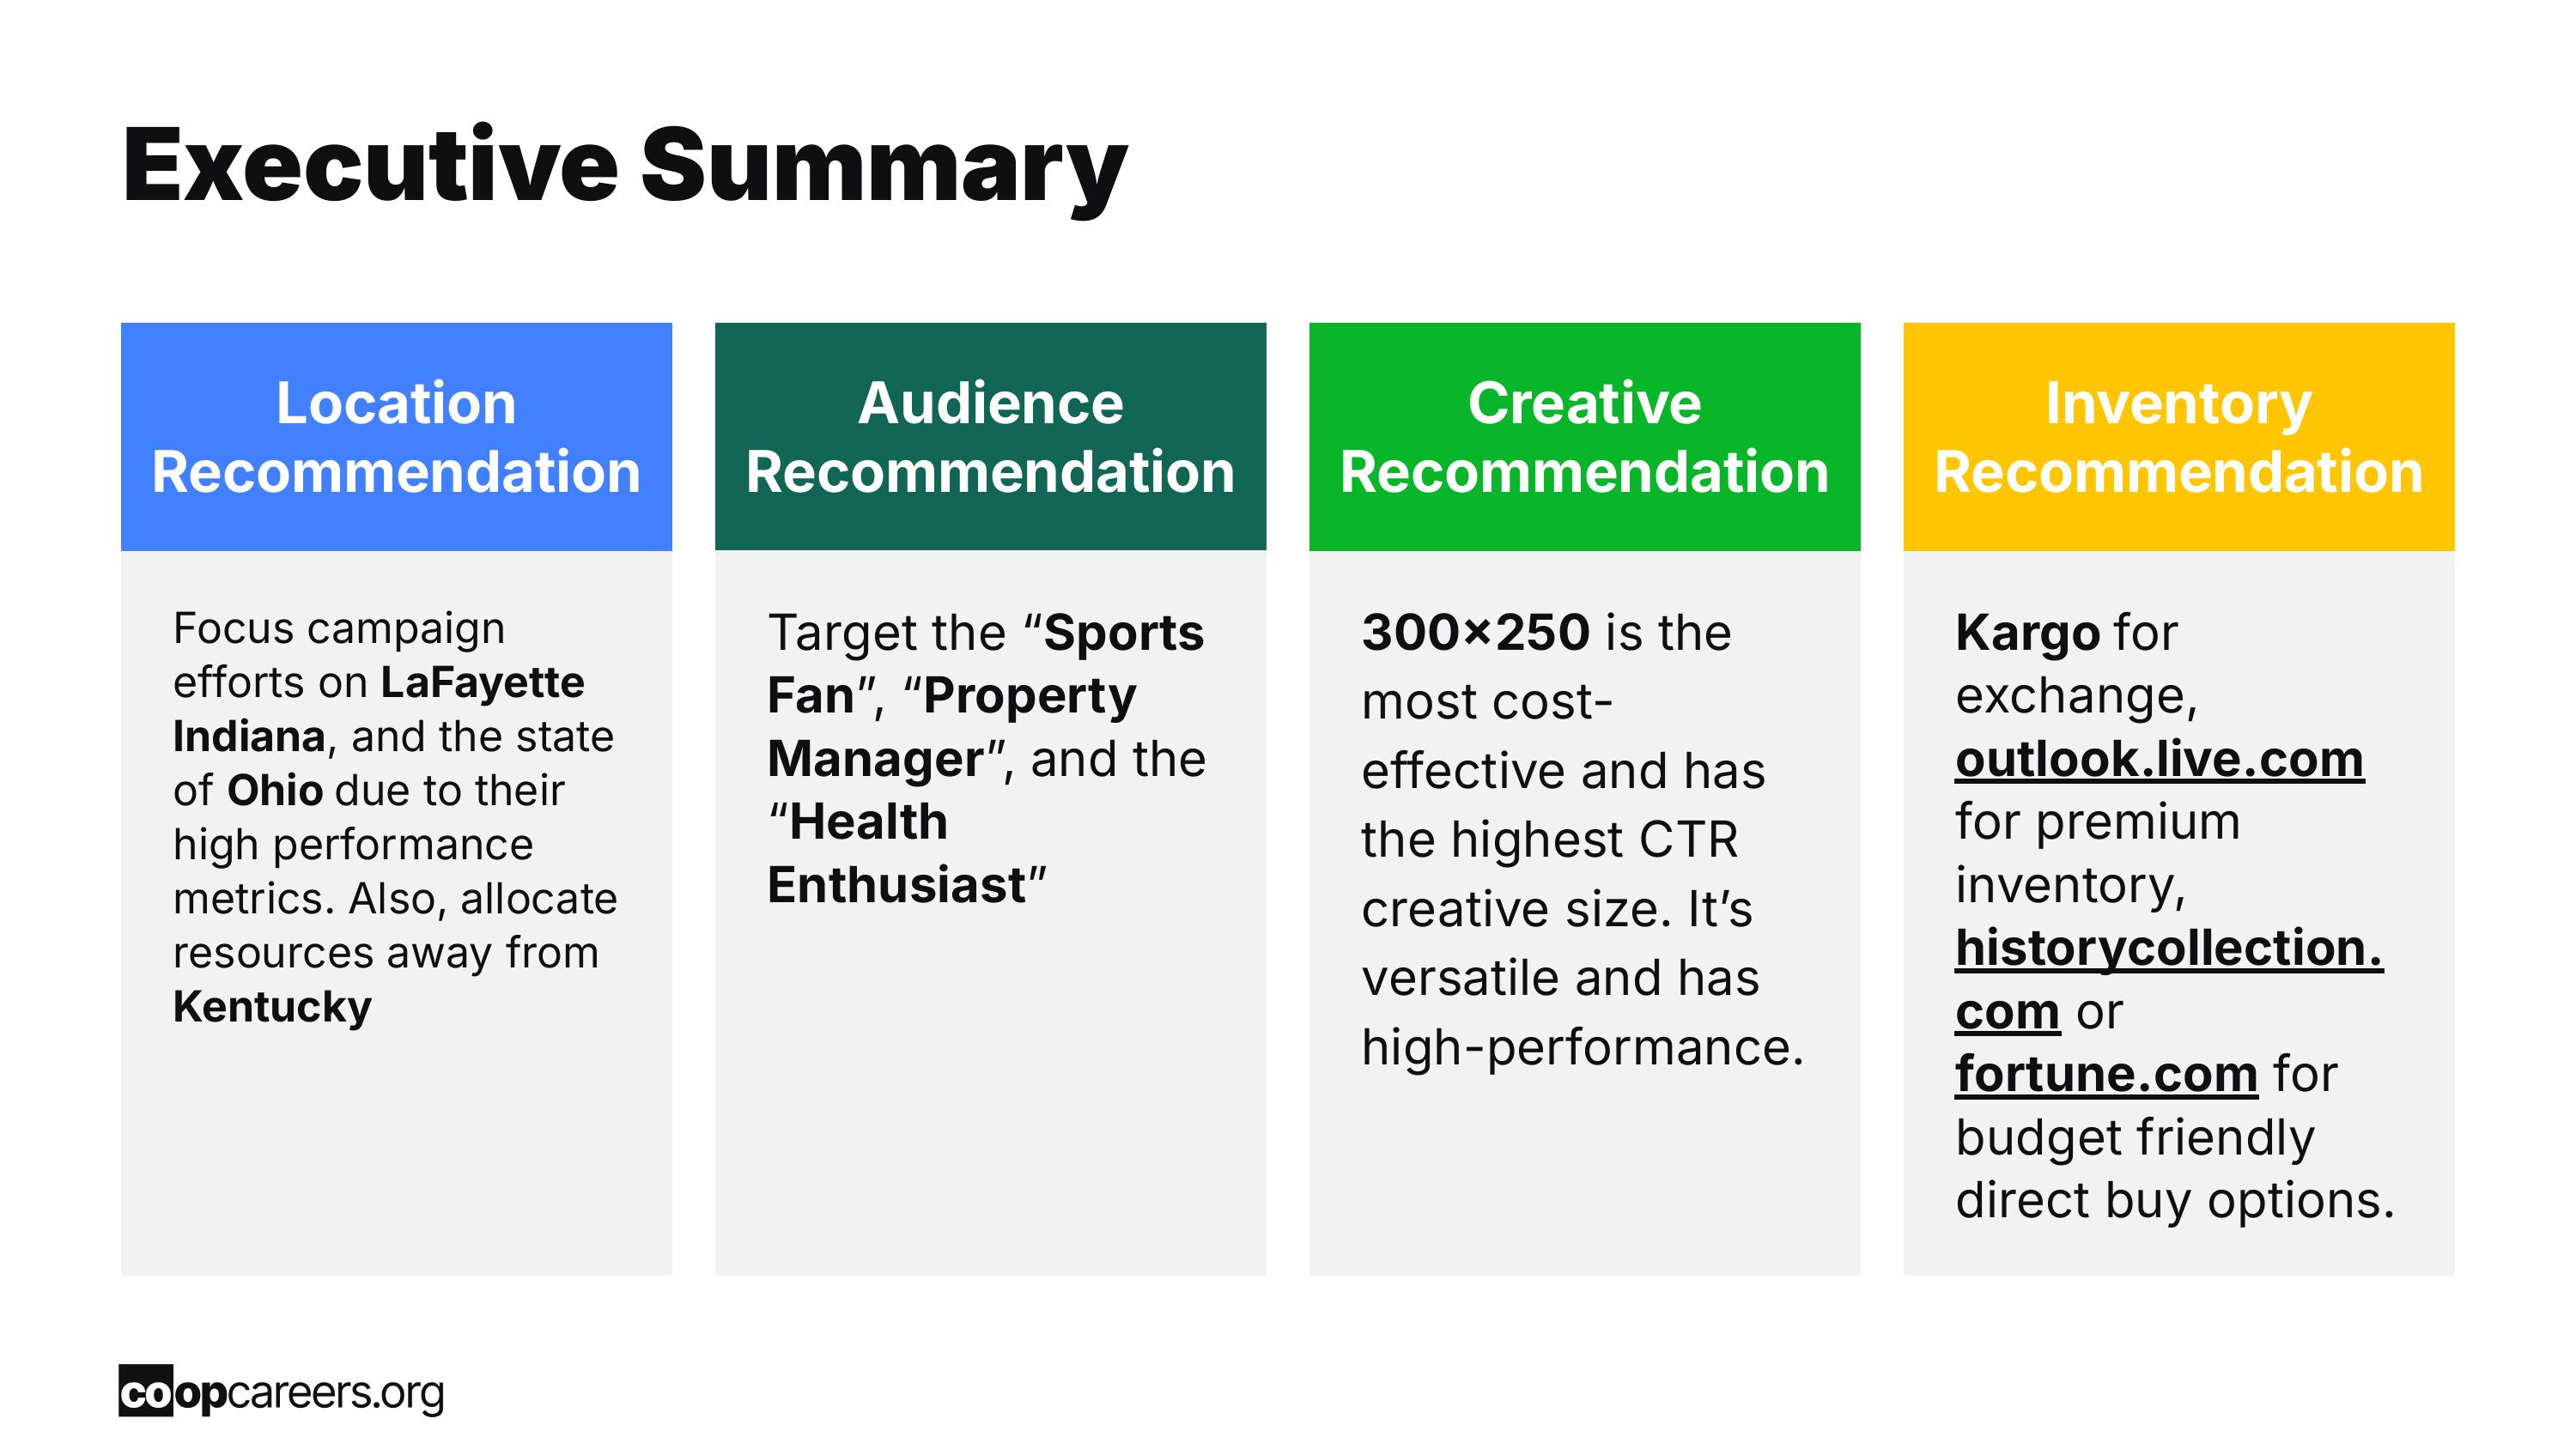
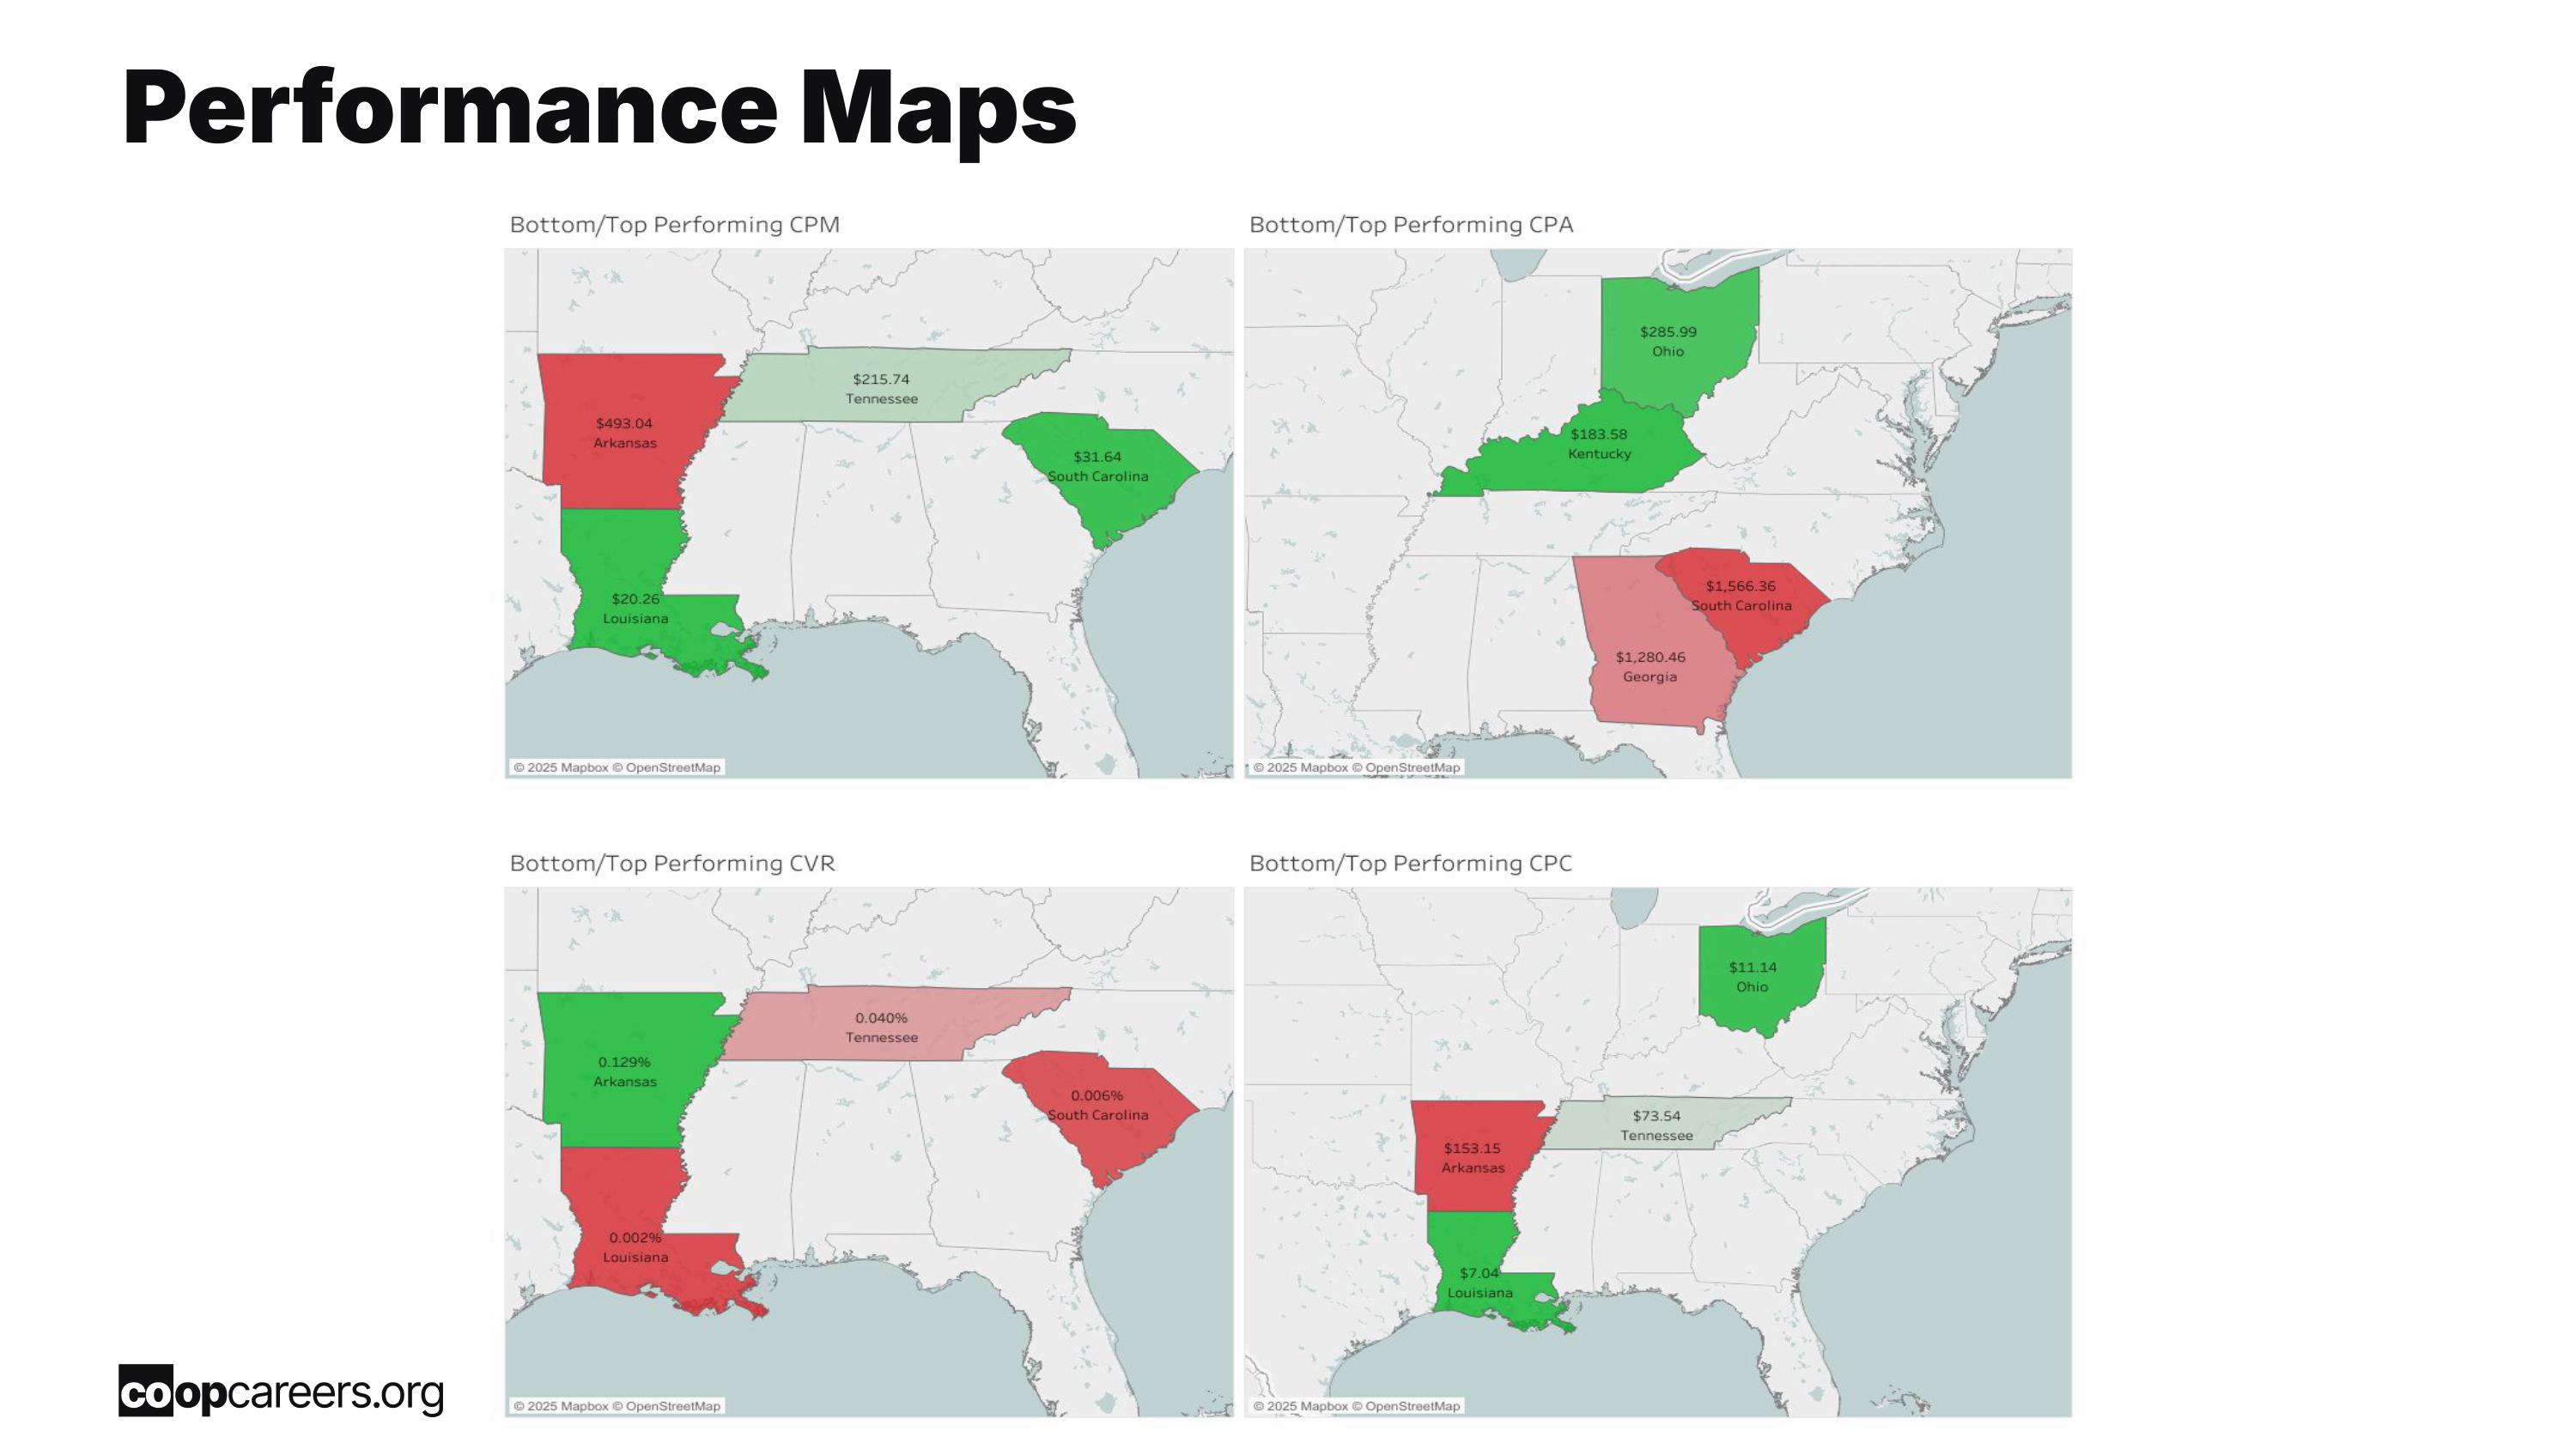
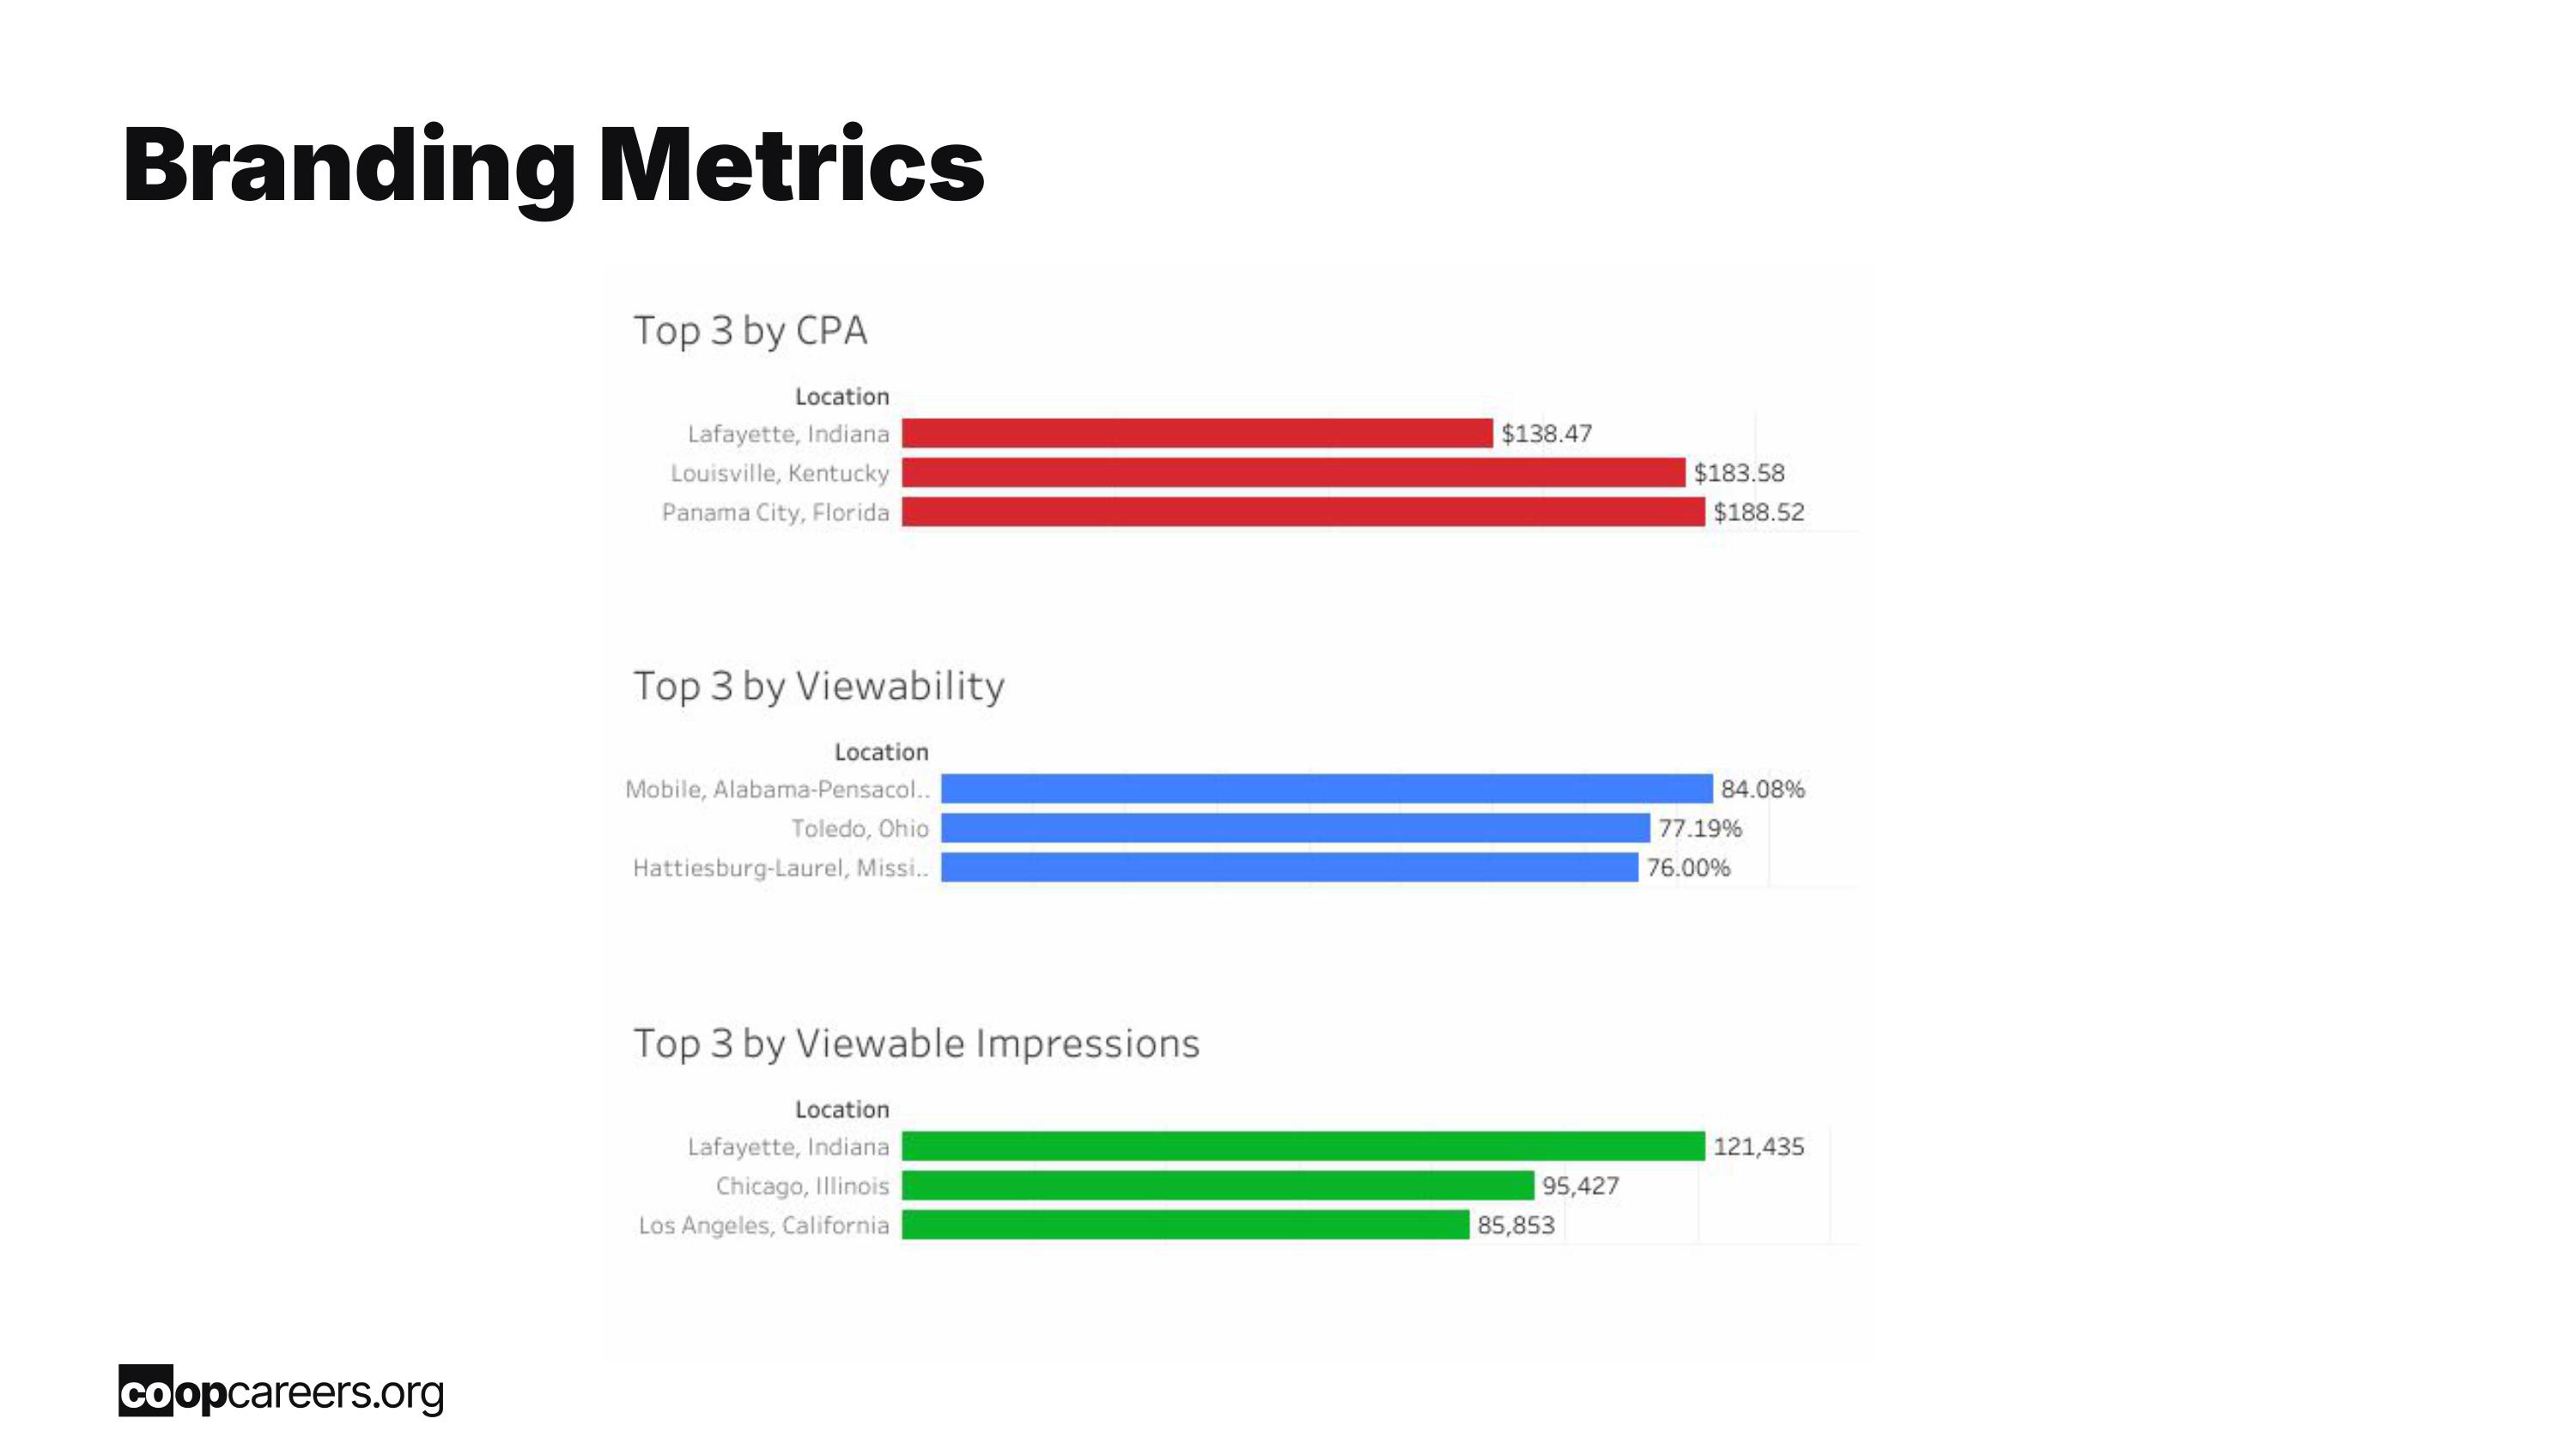
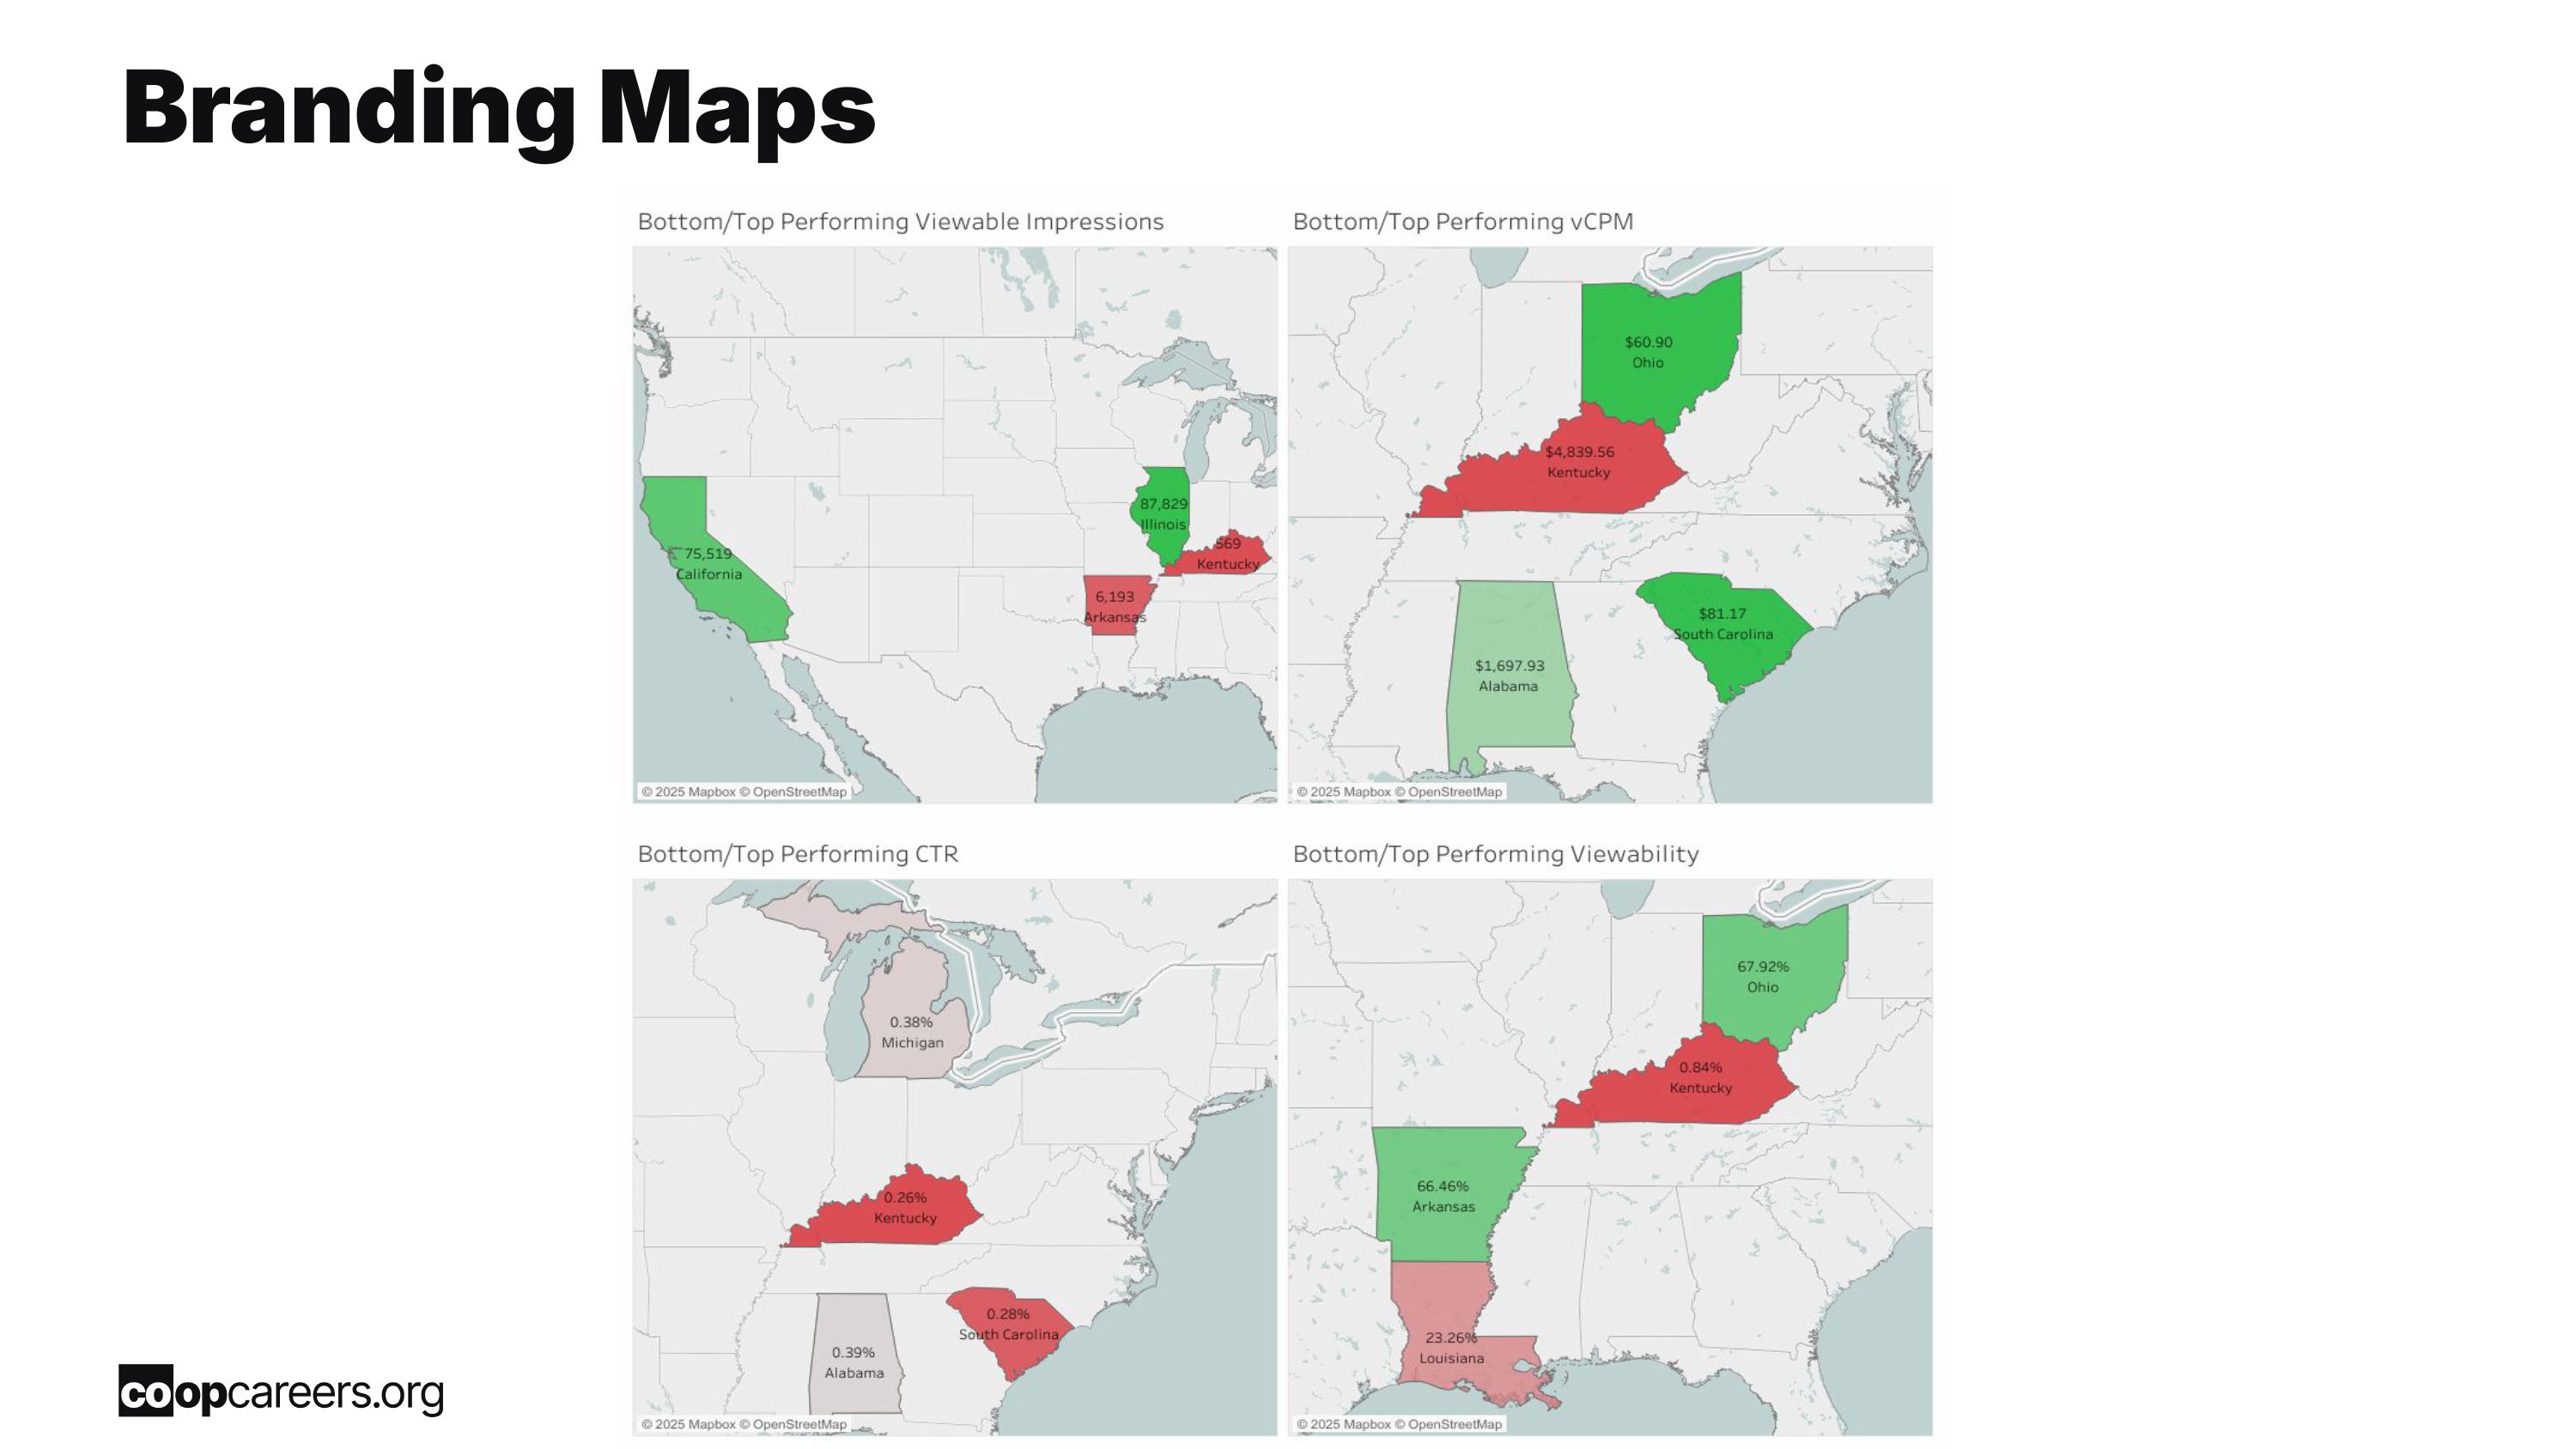
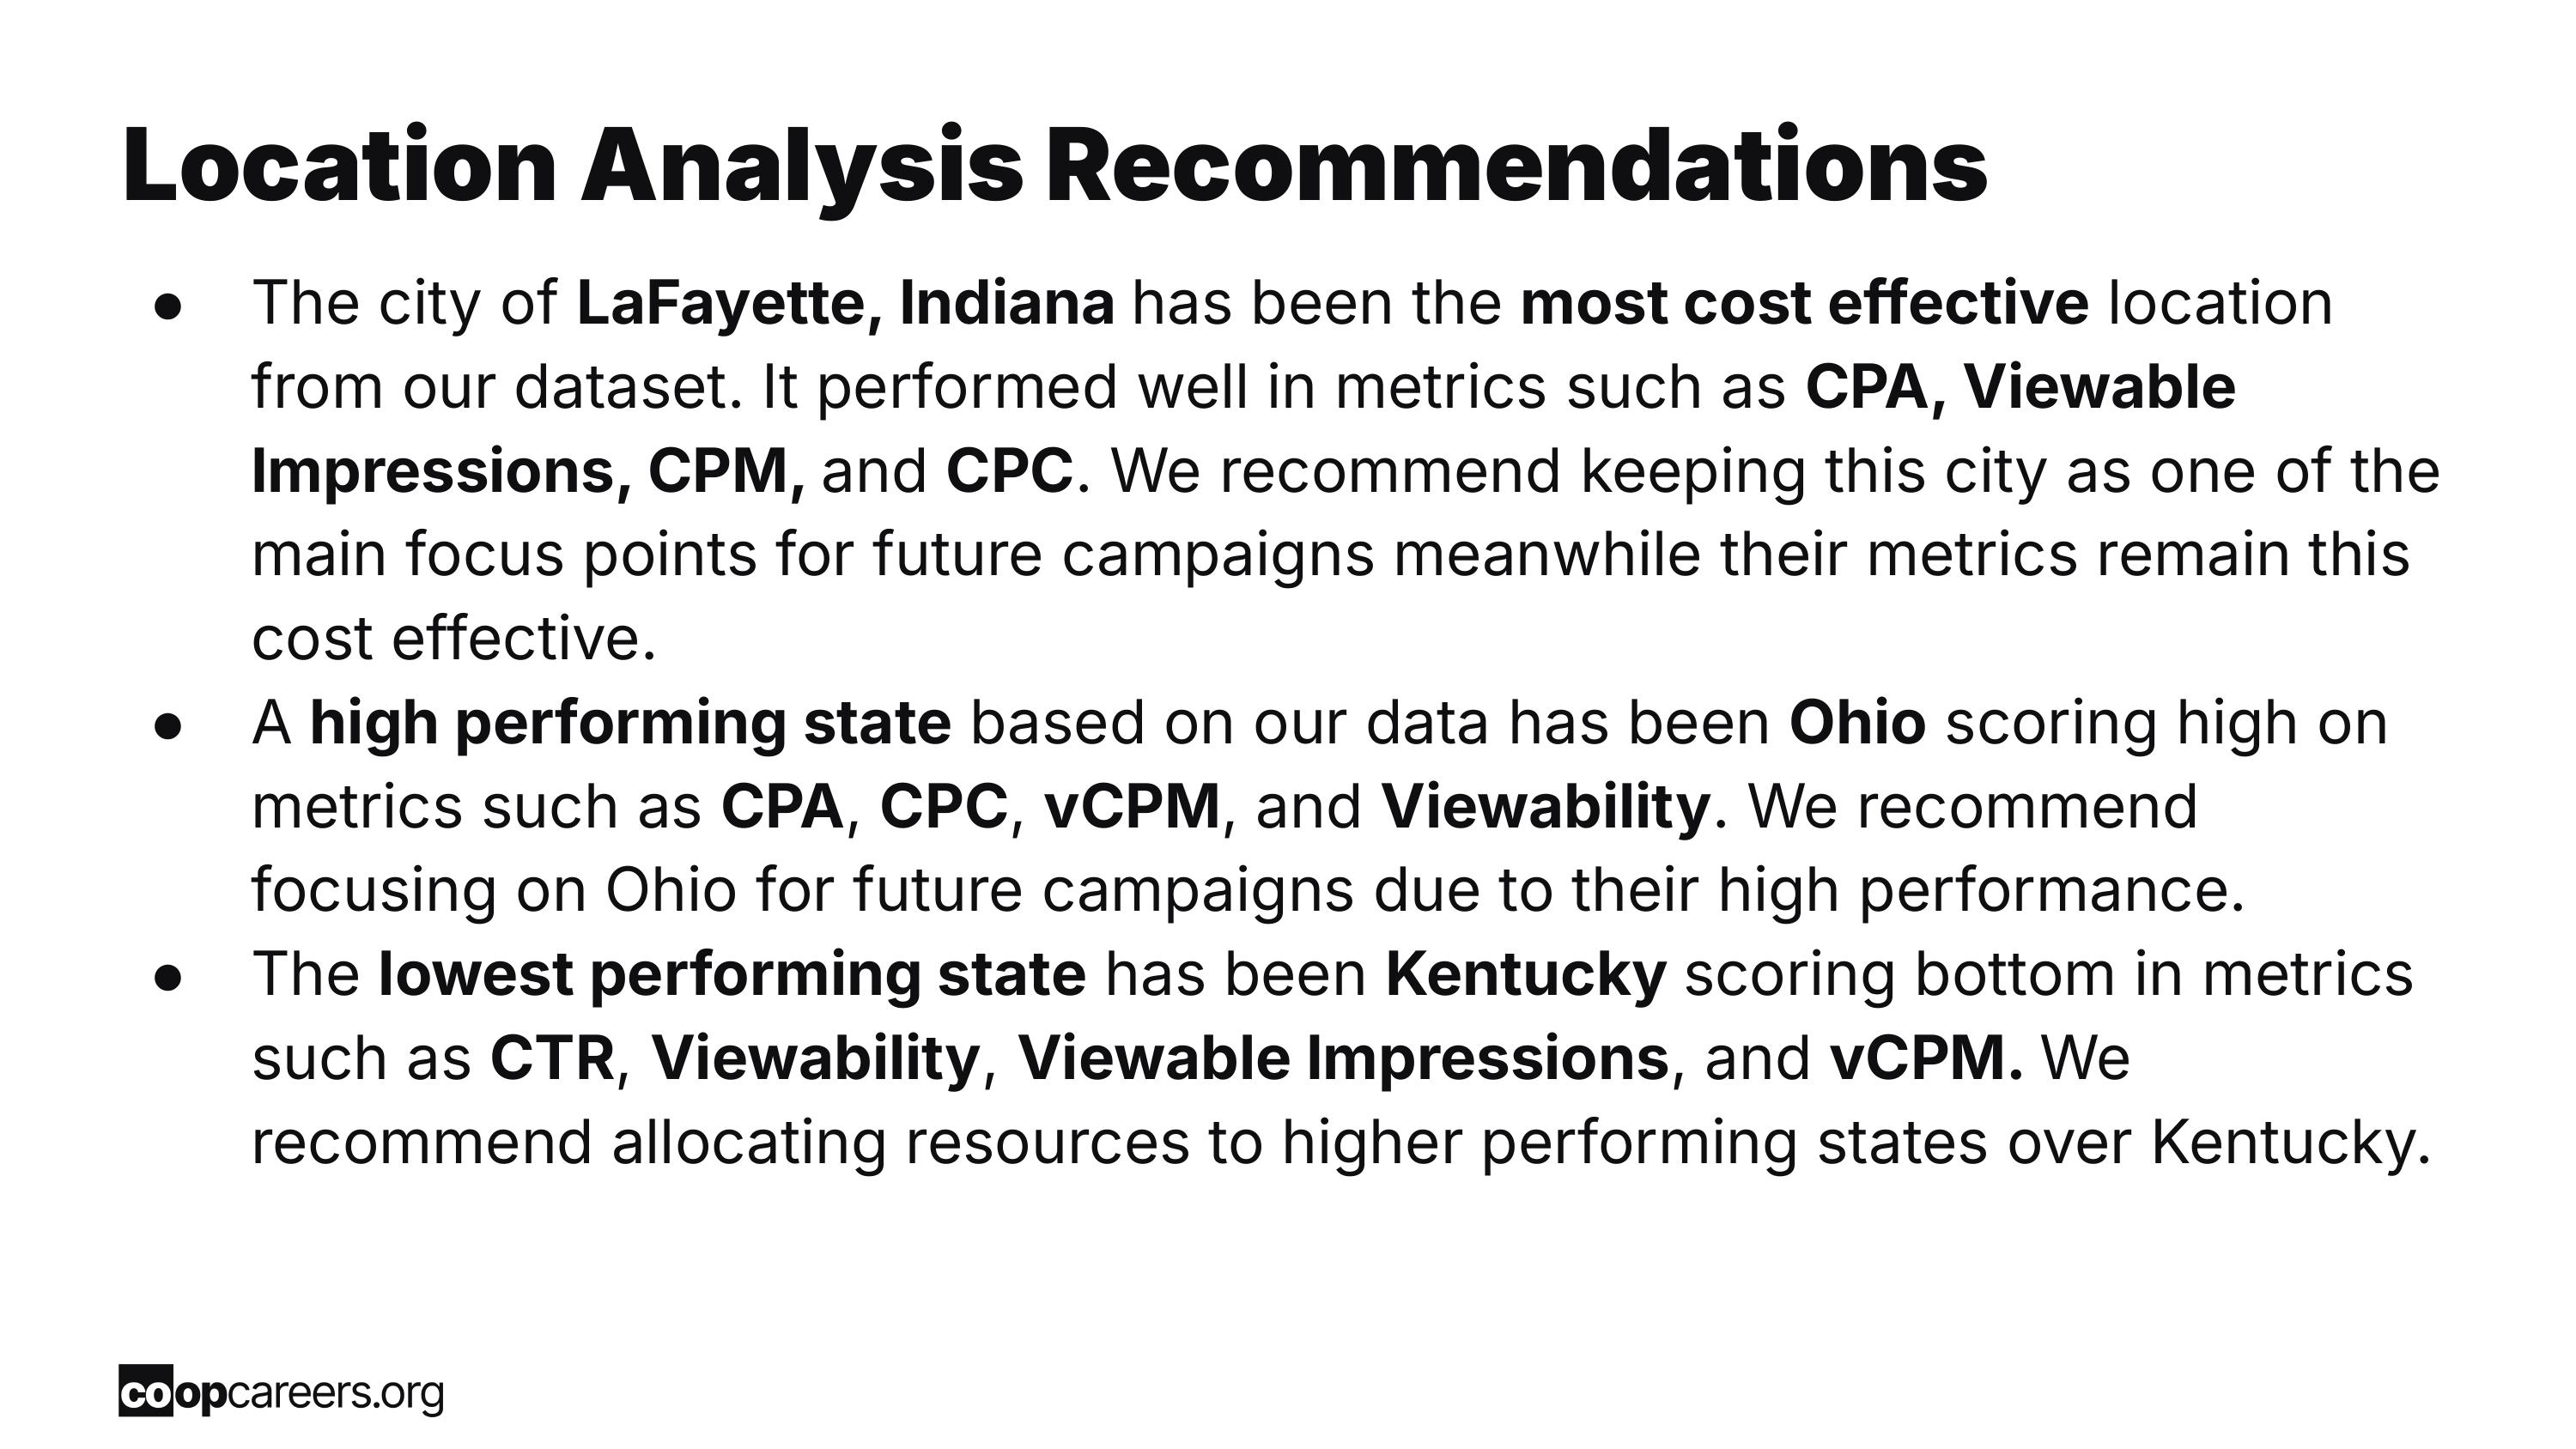
The city of LaFayette, Indiana, has been the most cost-effective location from our dataset. It has the lowest CPA of $138.47 and the highest average Viewable Impressions of 121,435 impressions. Additionally, Lafayette, Indiana, also has the lowest CPM of $7.96 and the lowest CPC of $3.96. All of these numbers are below the targeted KPIs we were given, so this city should be a focus point for future campaigns as long as its data remains this cost-effective. A high-performing state, based on our data, has been Ohio, scoring high on metrics such as CPA, CPC, vCPM, and Viewability. We recommend focusing on Ohio for future campaigns due to its high performance. The lowest performing state has been Kentucky, scoring bottom in metrics such as CTR, Viewability, Viewable Impressions, and vCPM. We recommend allocating resources to high-performing states.Audience Analysis
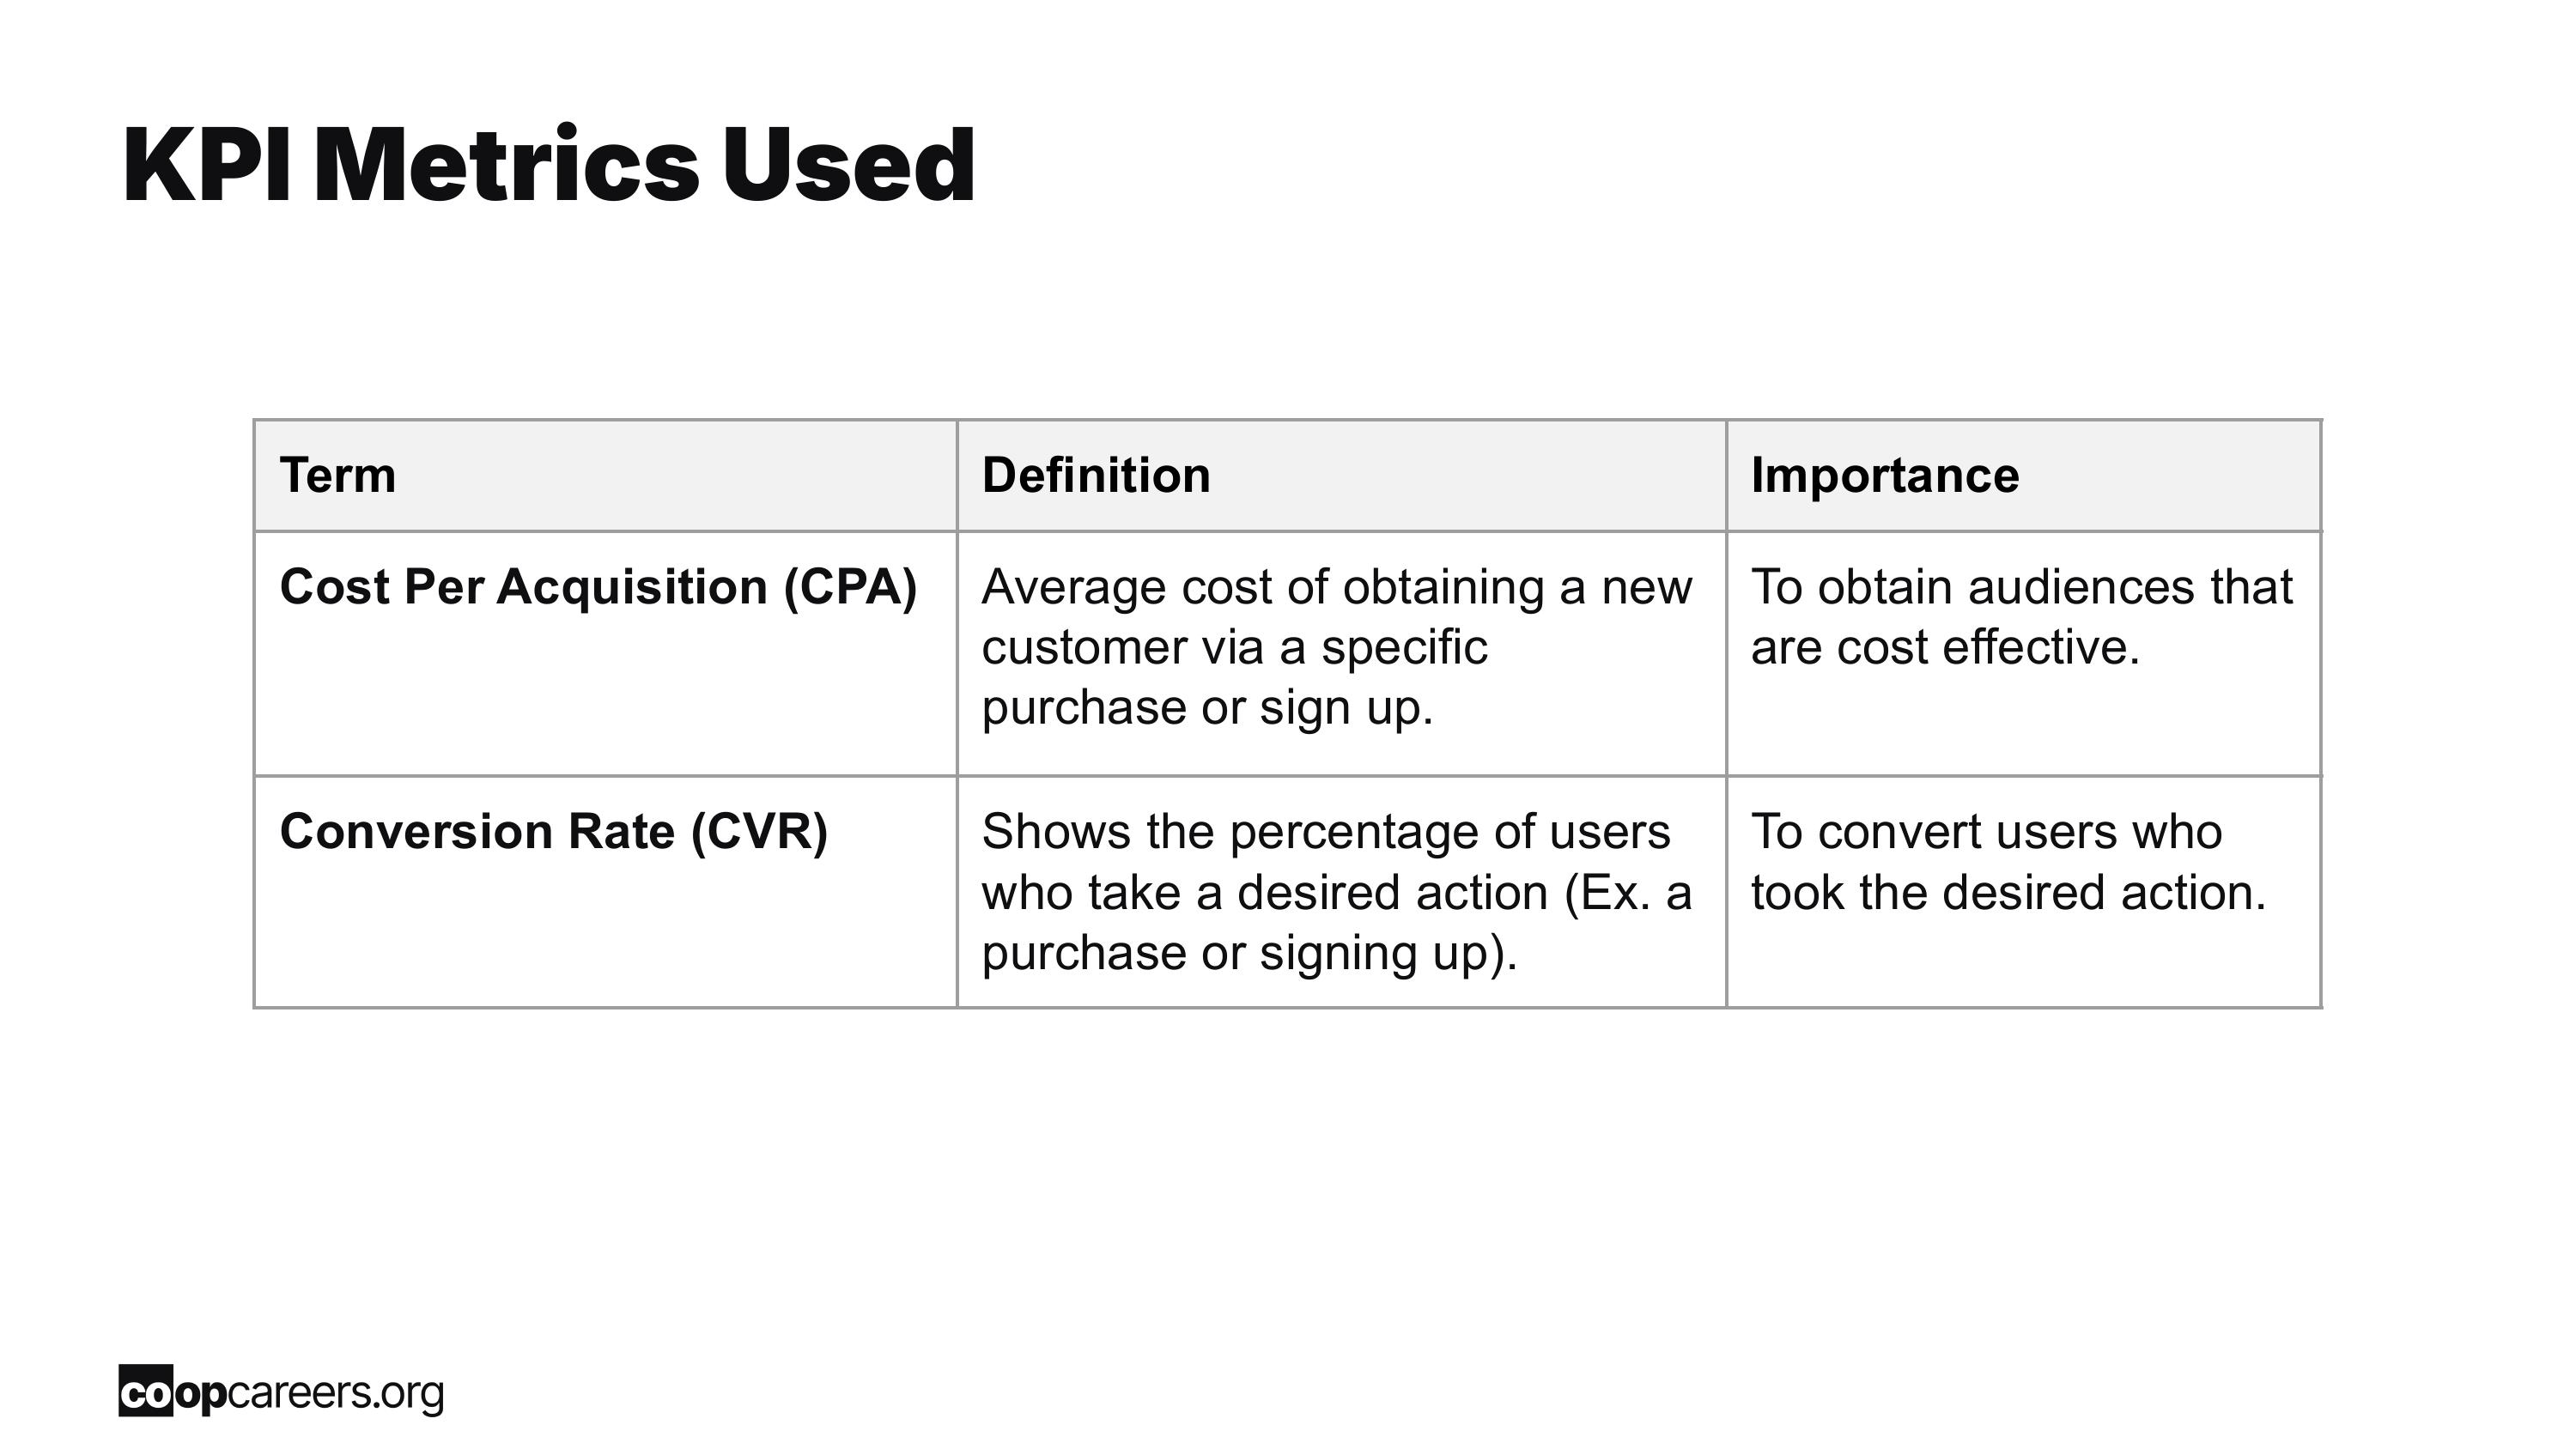
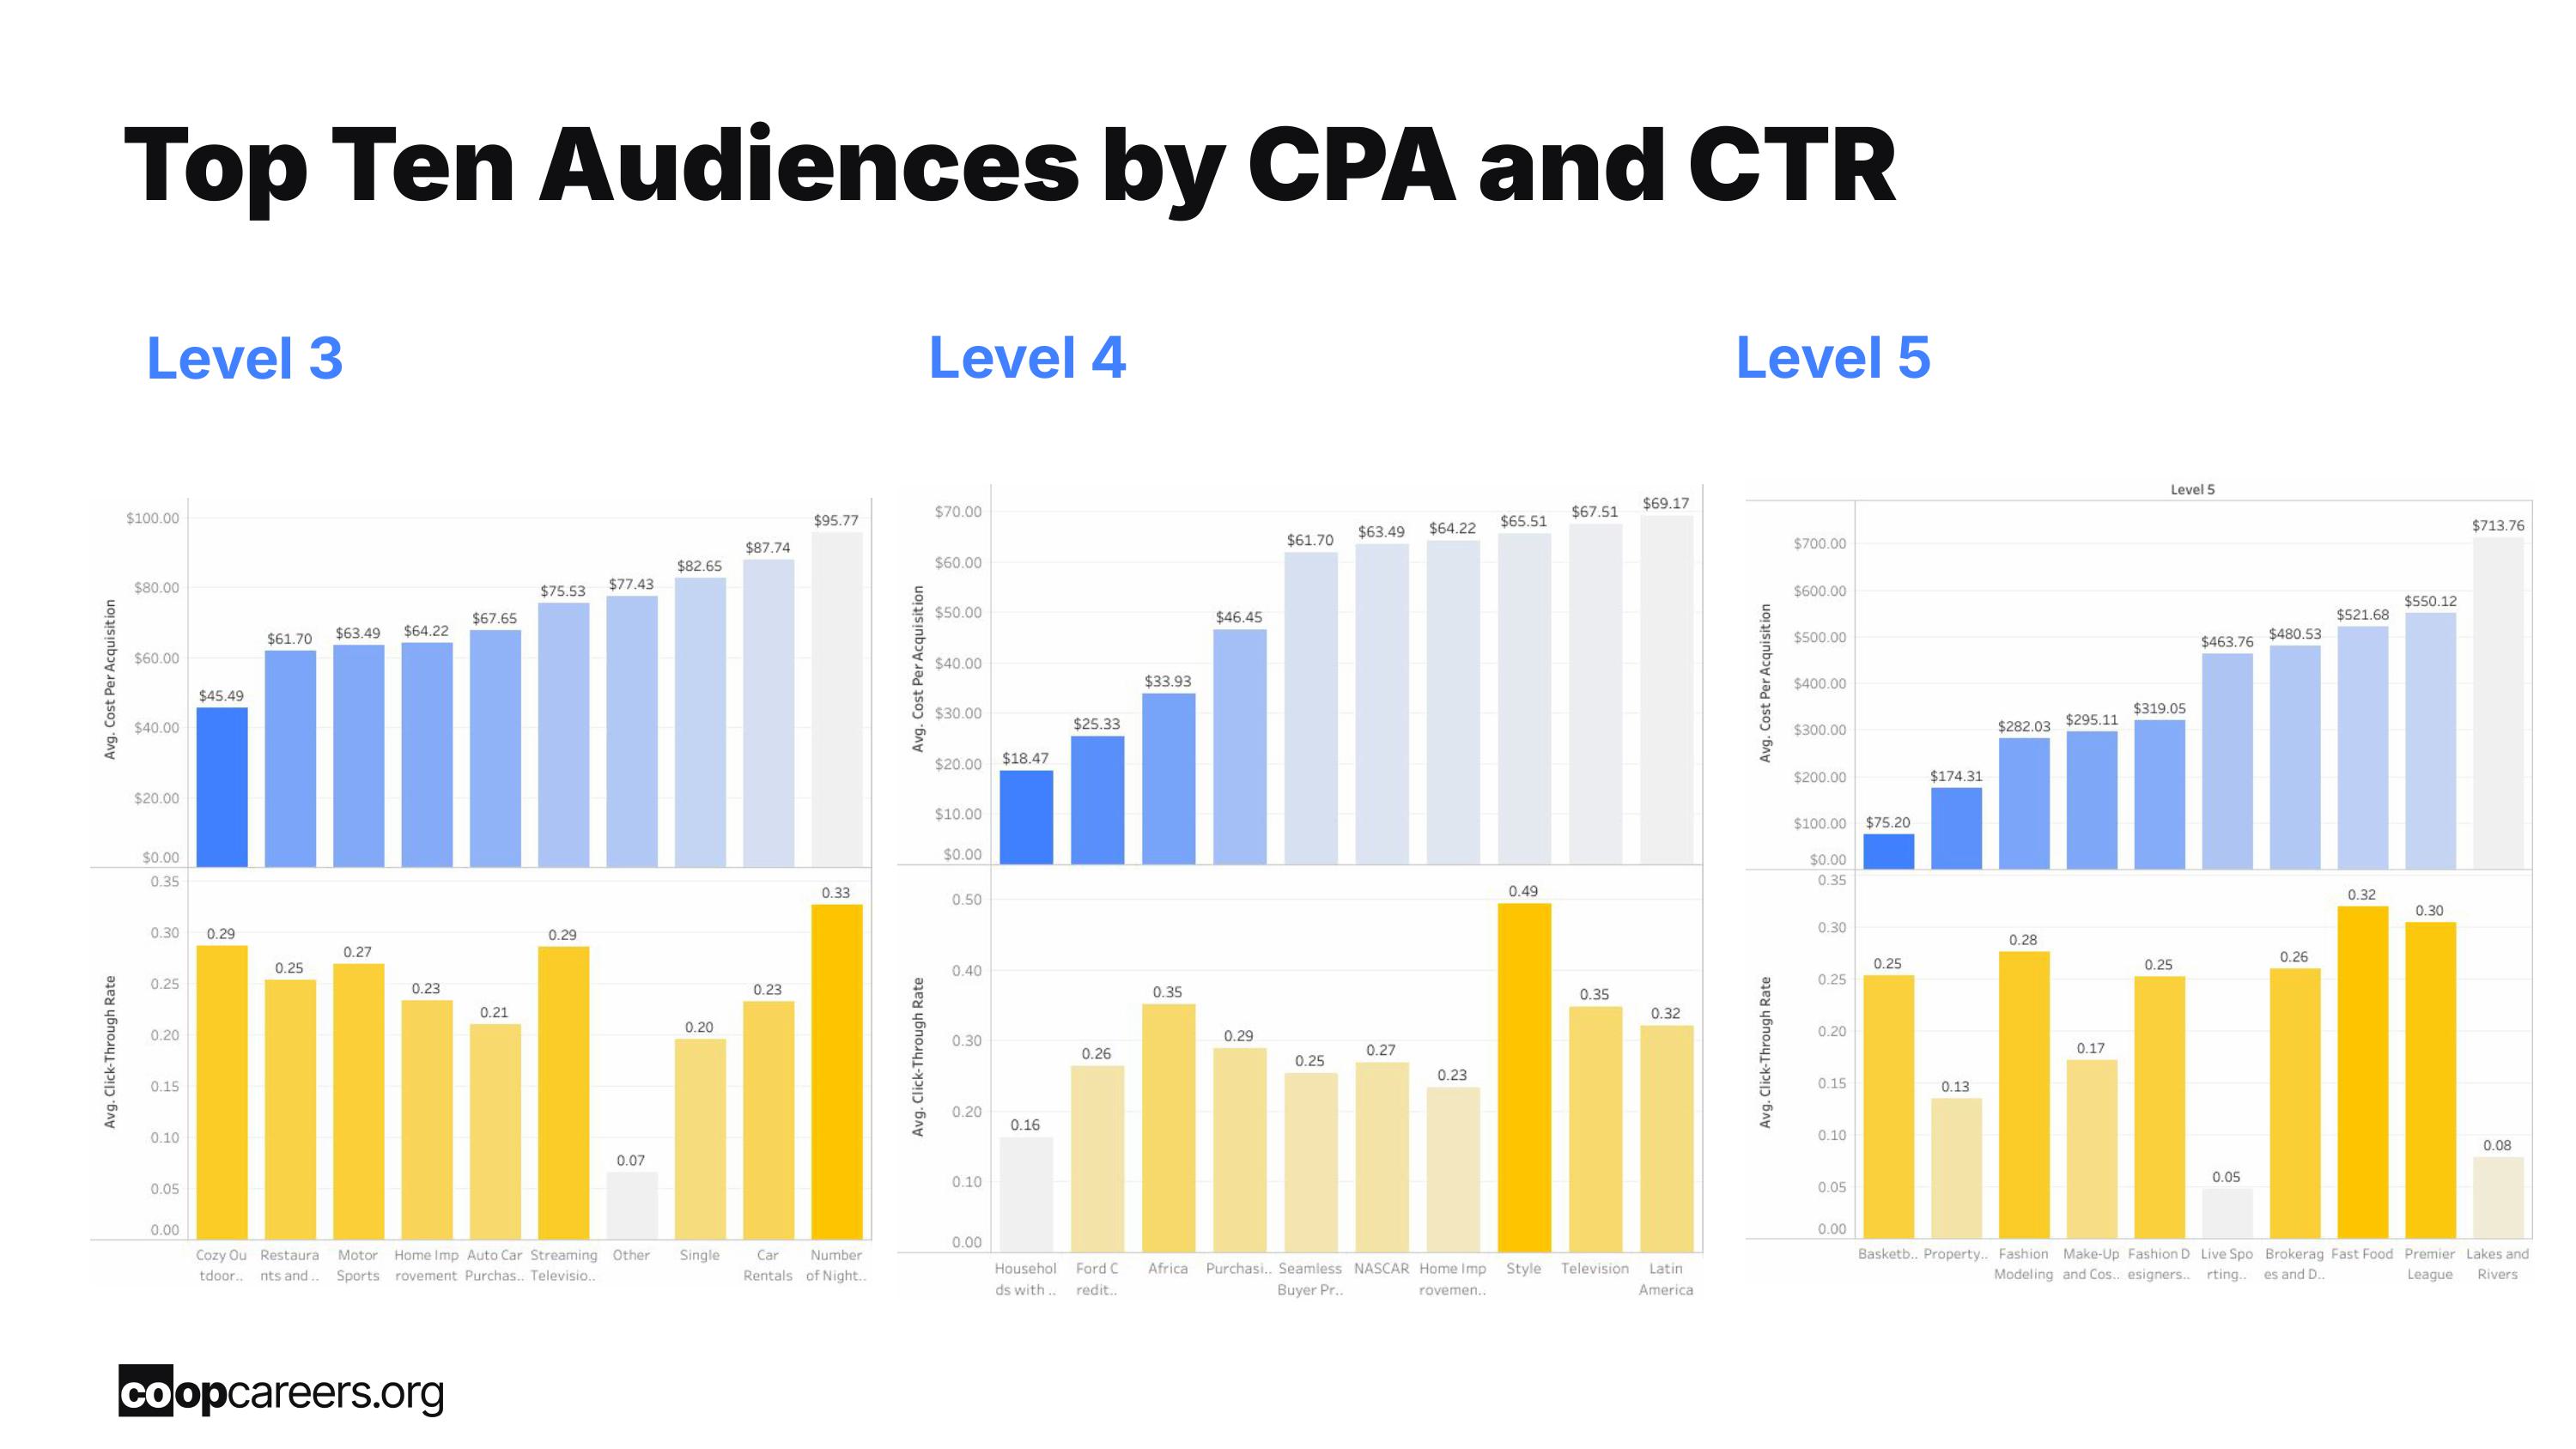
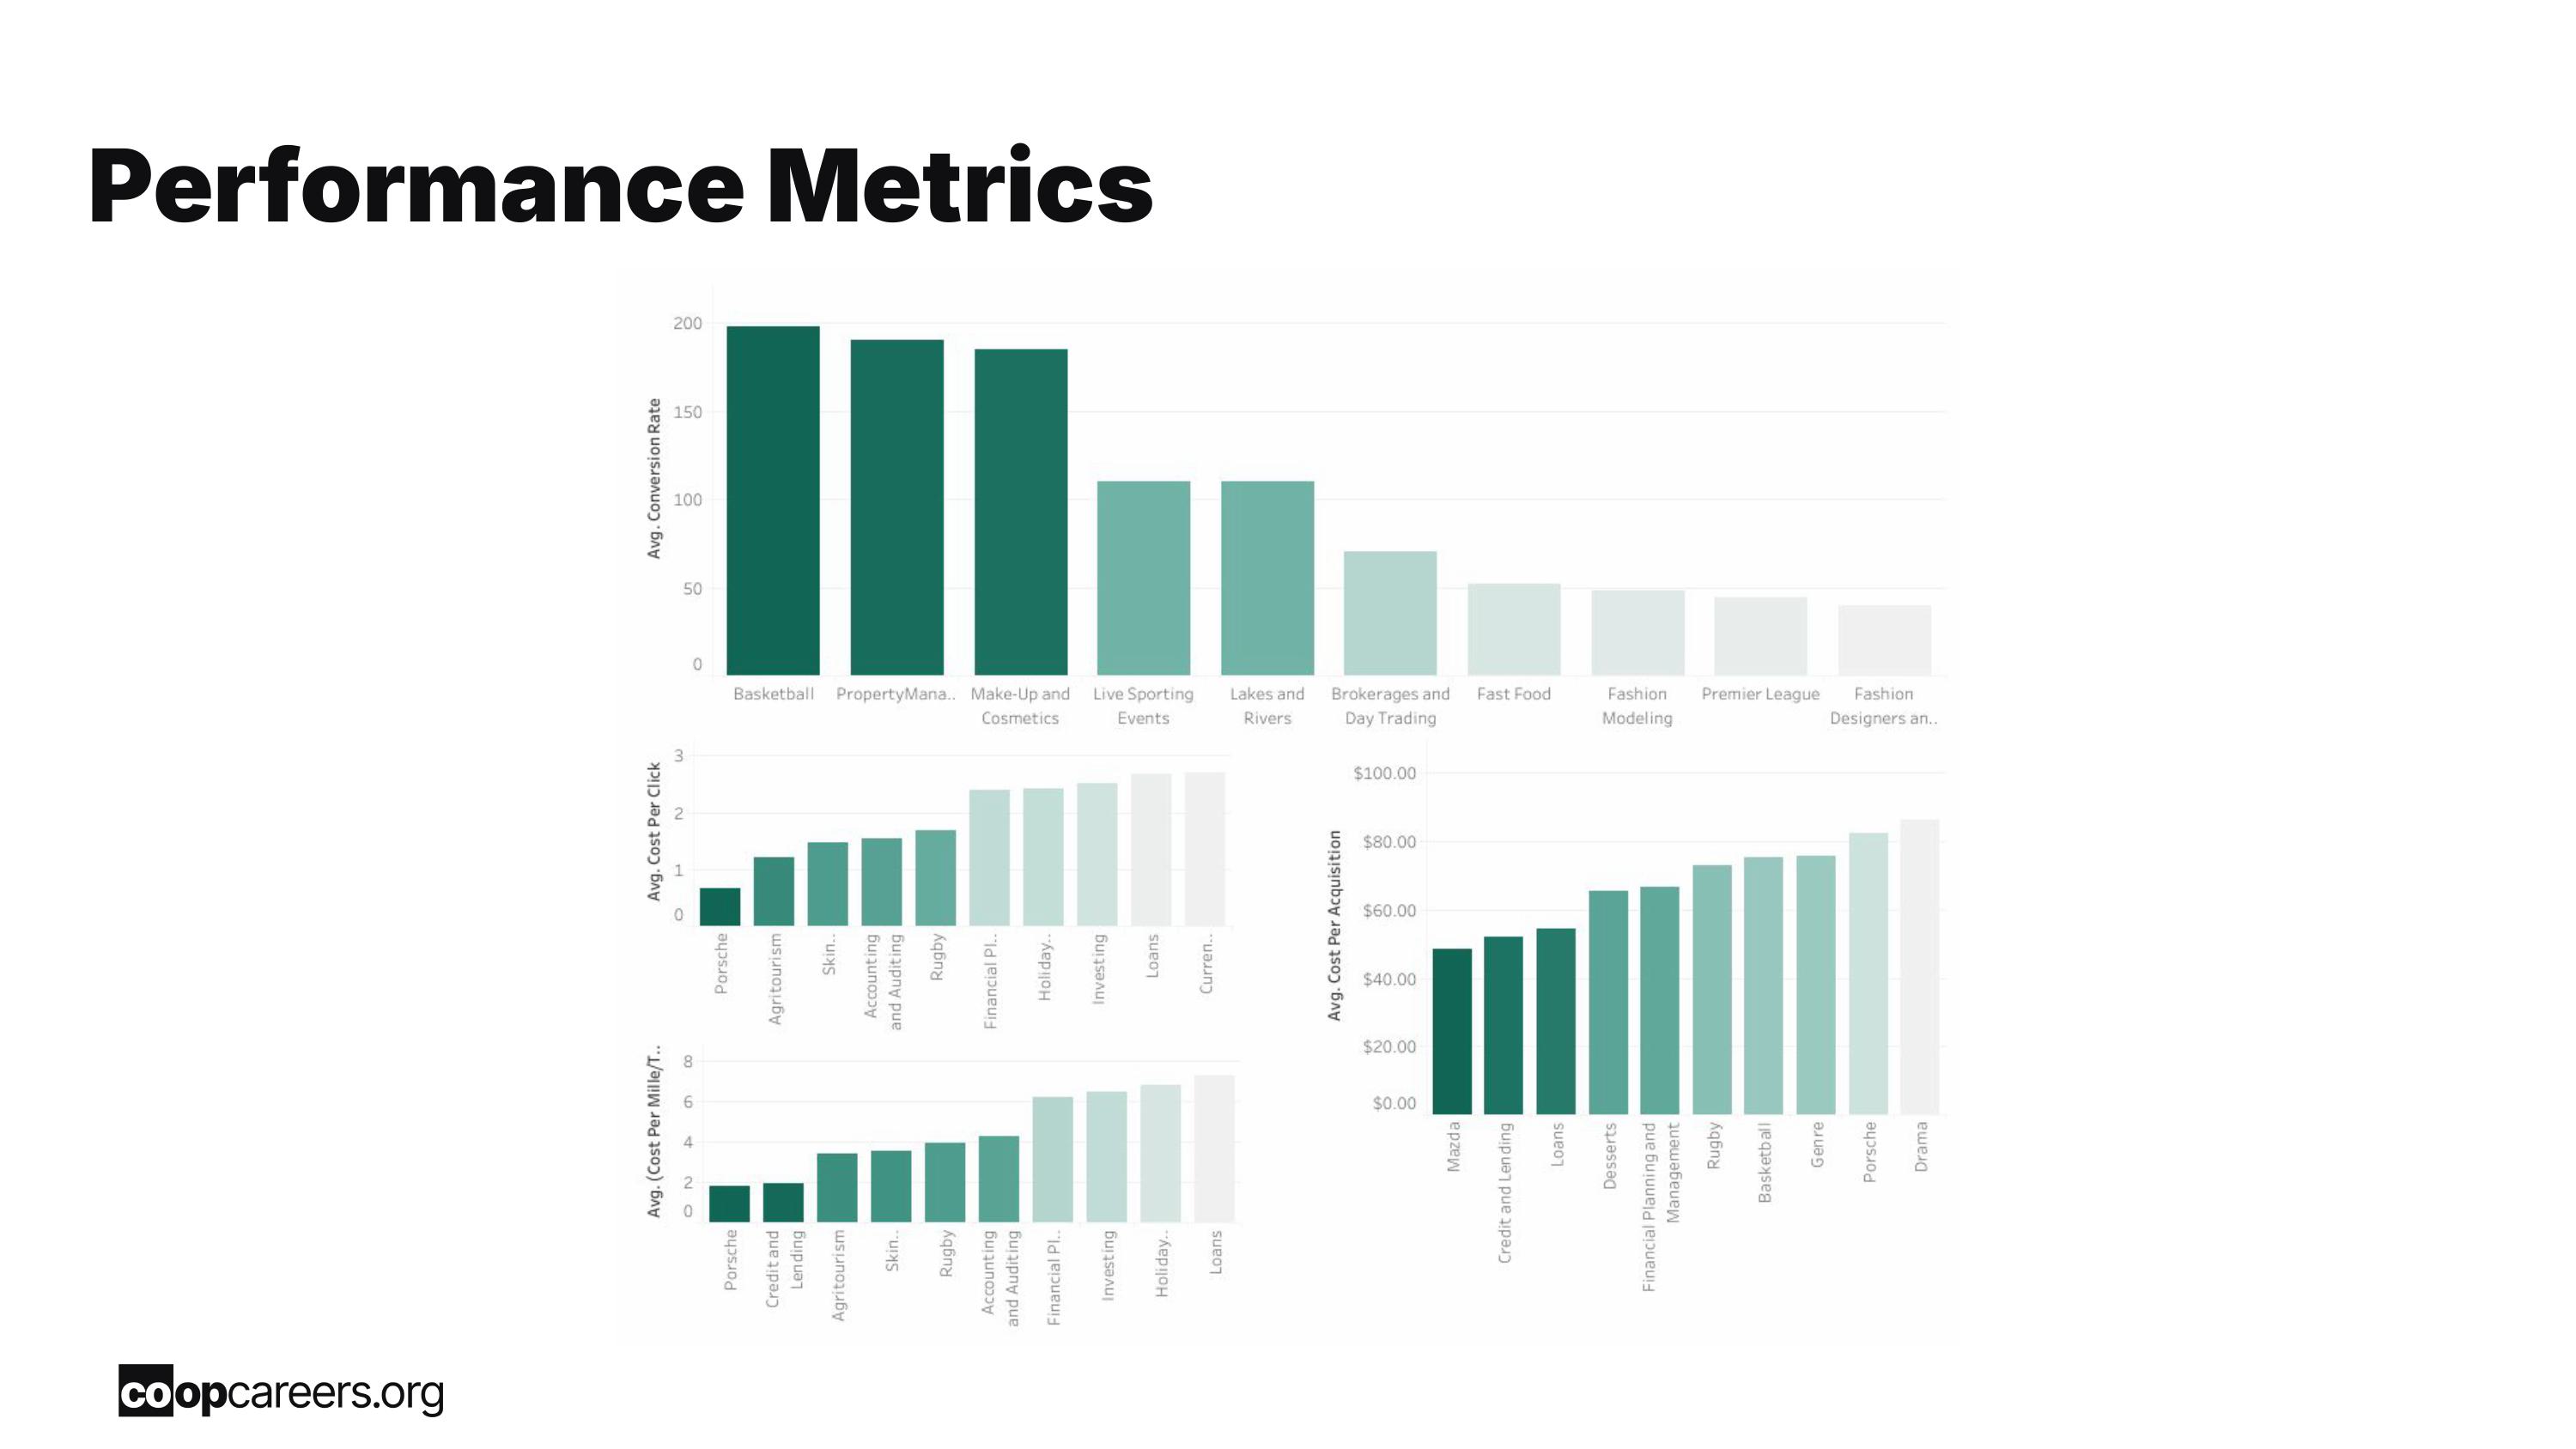
Due to their low CPA, high CTR, and high CVR, the top three personas that were derived from the data were “Basketball”, “Property Manager”, and “Make-up and Cosmetics”. These audience personas were not only cost-effective, but they also took the desired actions, like making a specific purchase or signing up for a subscription. In the future, an audience that might be desirable would be luxury car owners due to their high ranks in branding and performance metrics. This might be due to their ability to allocate funds towards multiple endeavors and their similarity to the previously stated audience personas.Creative Analysis
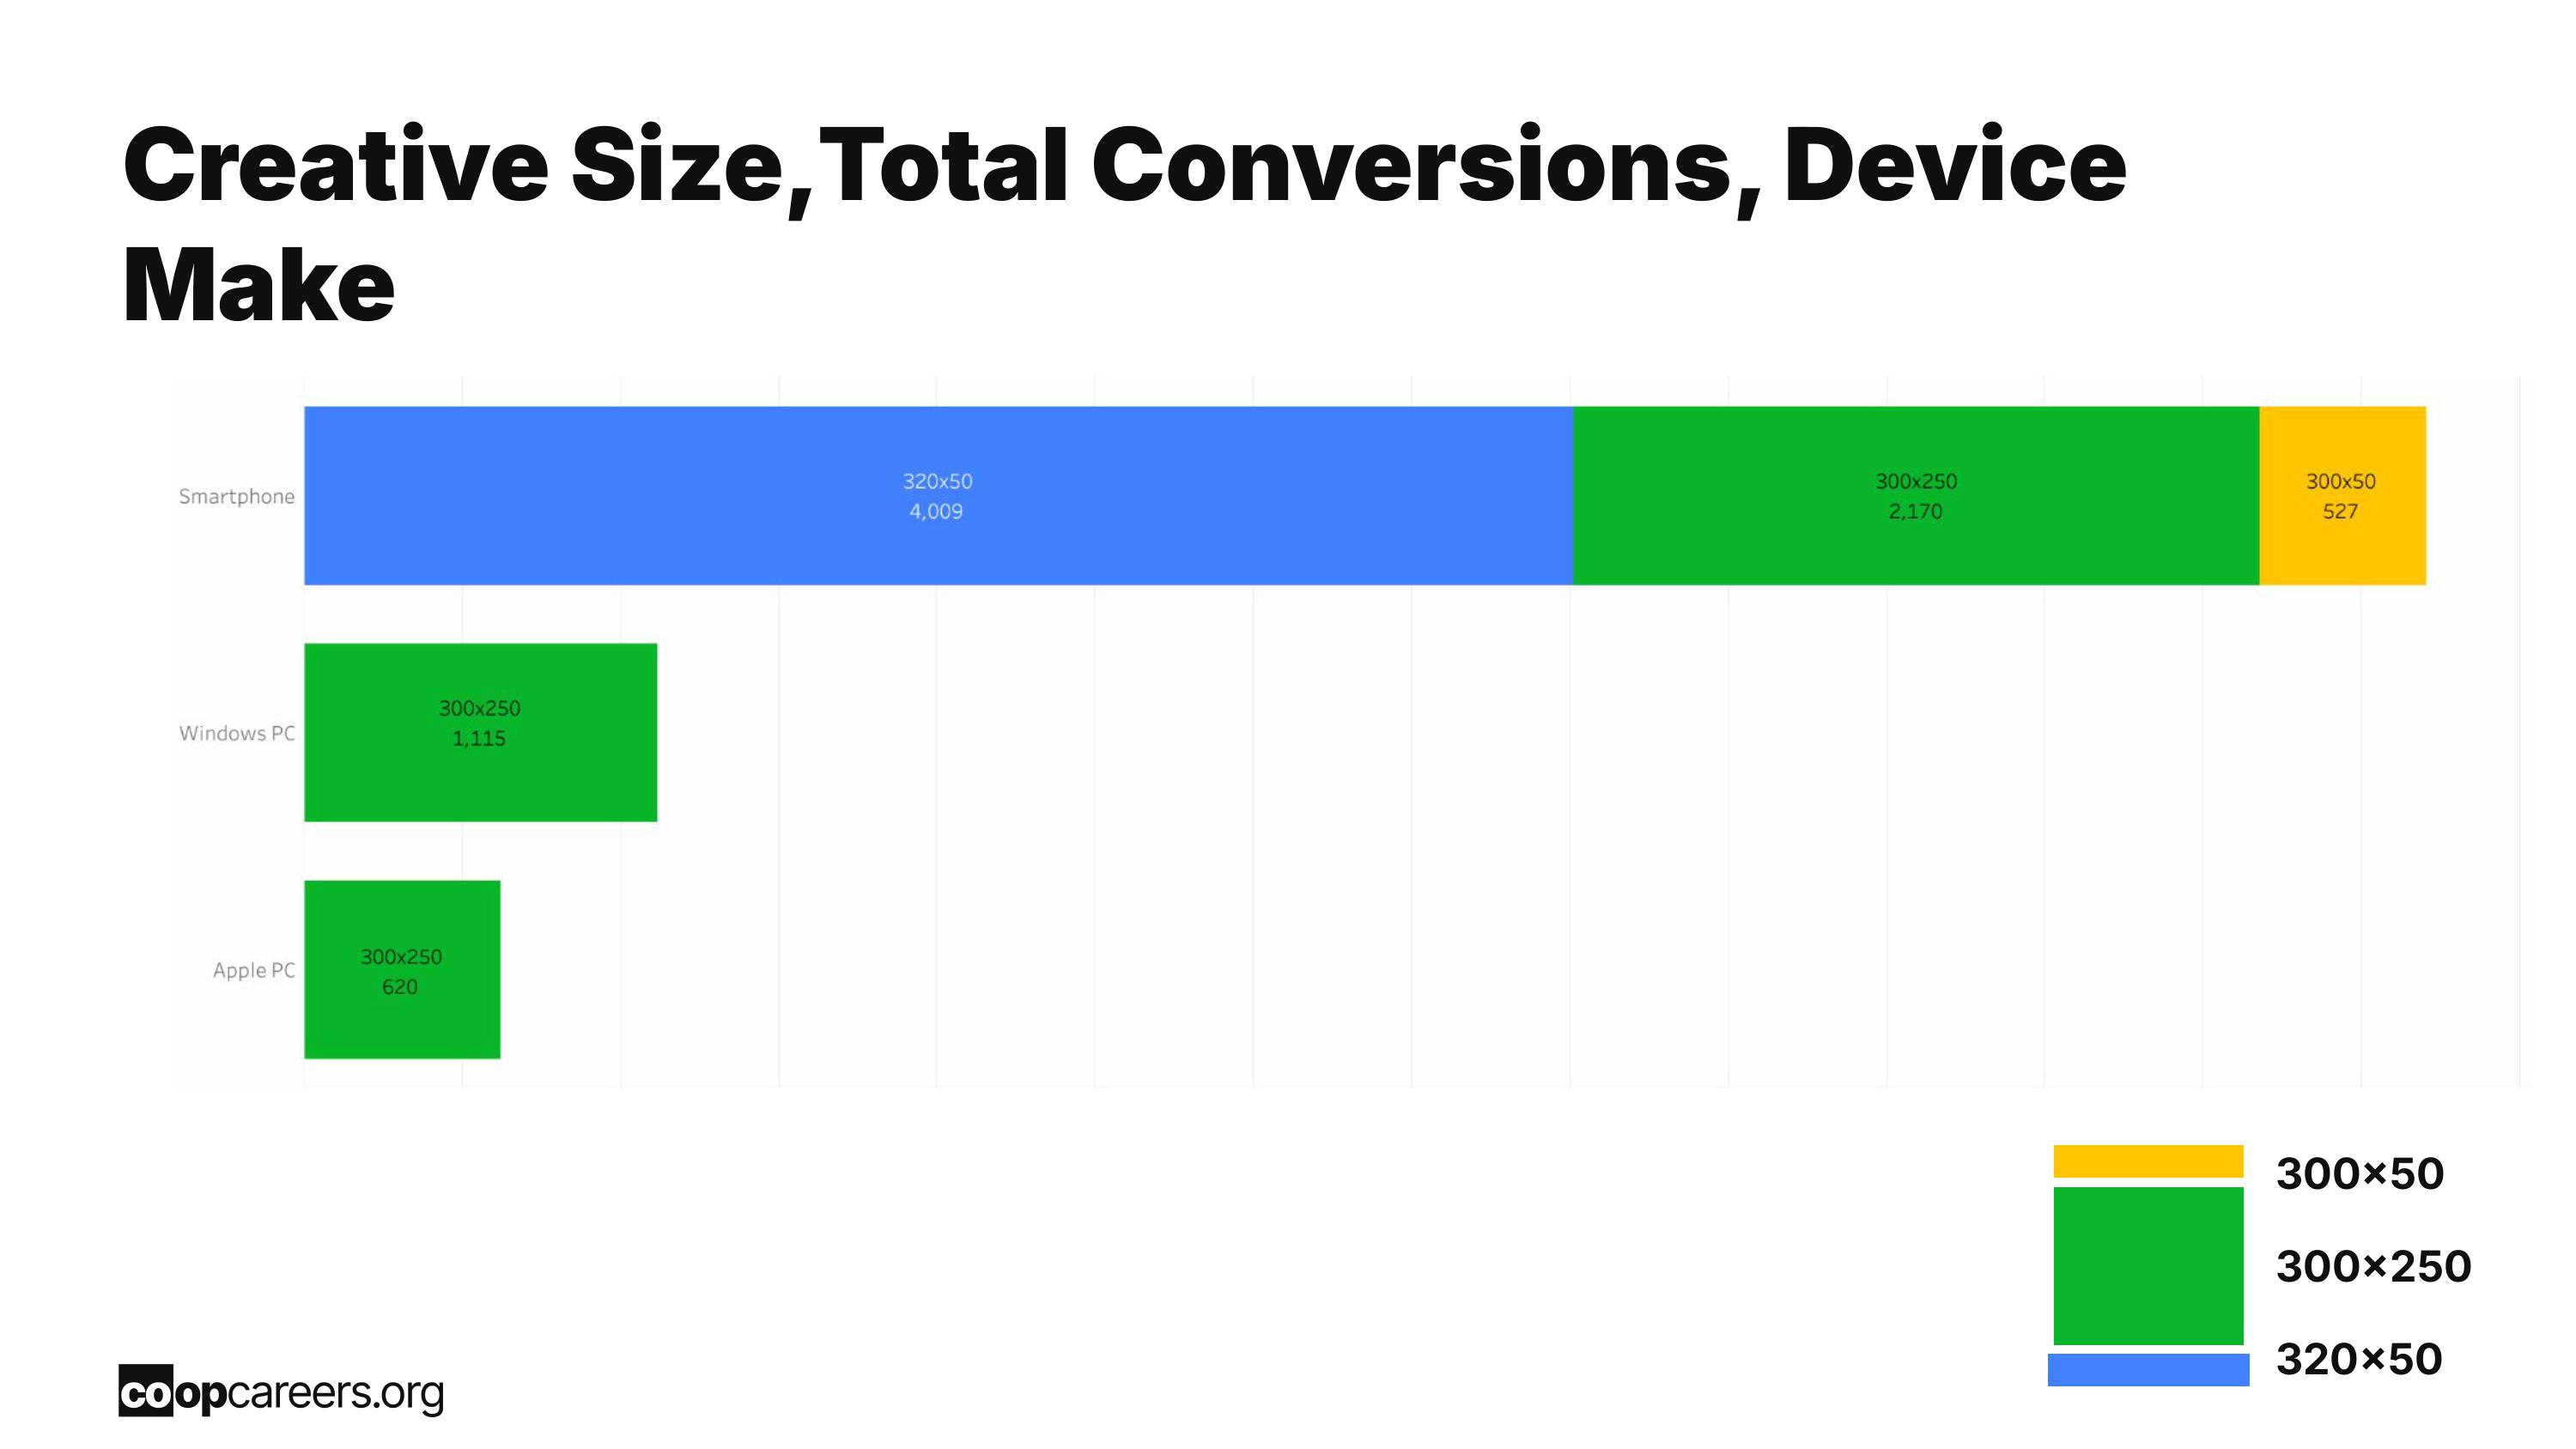
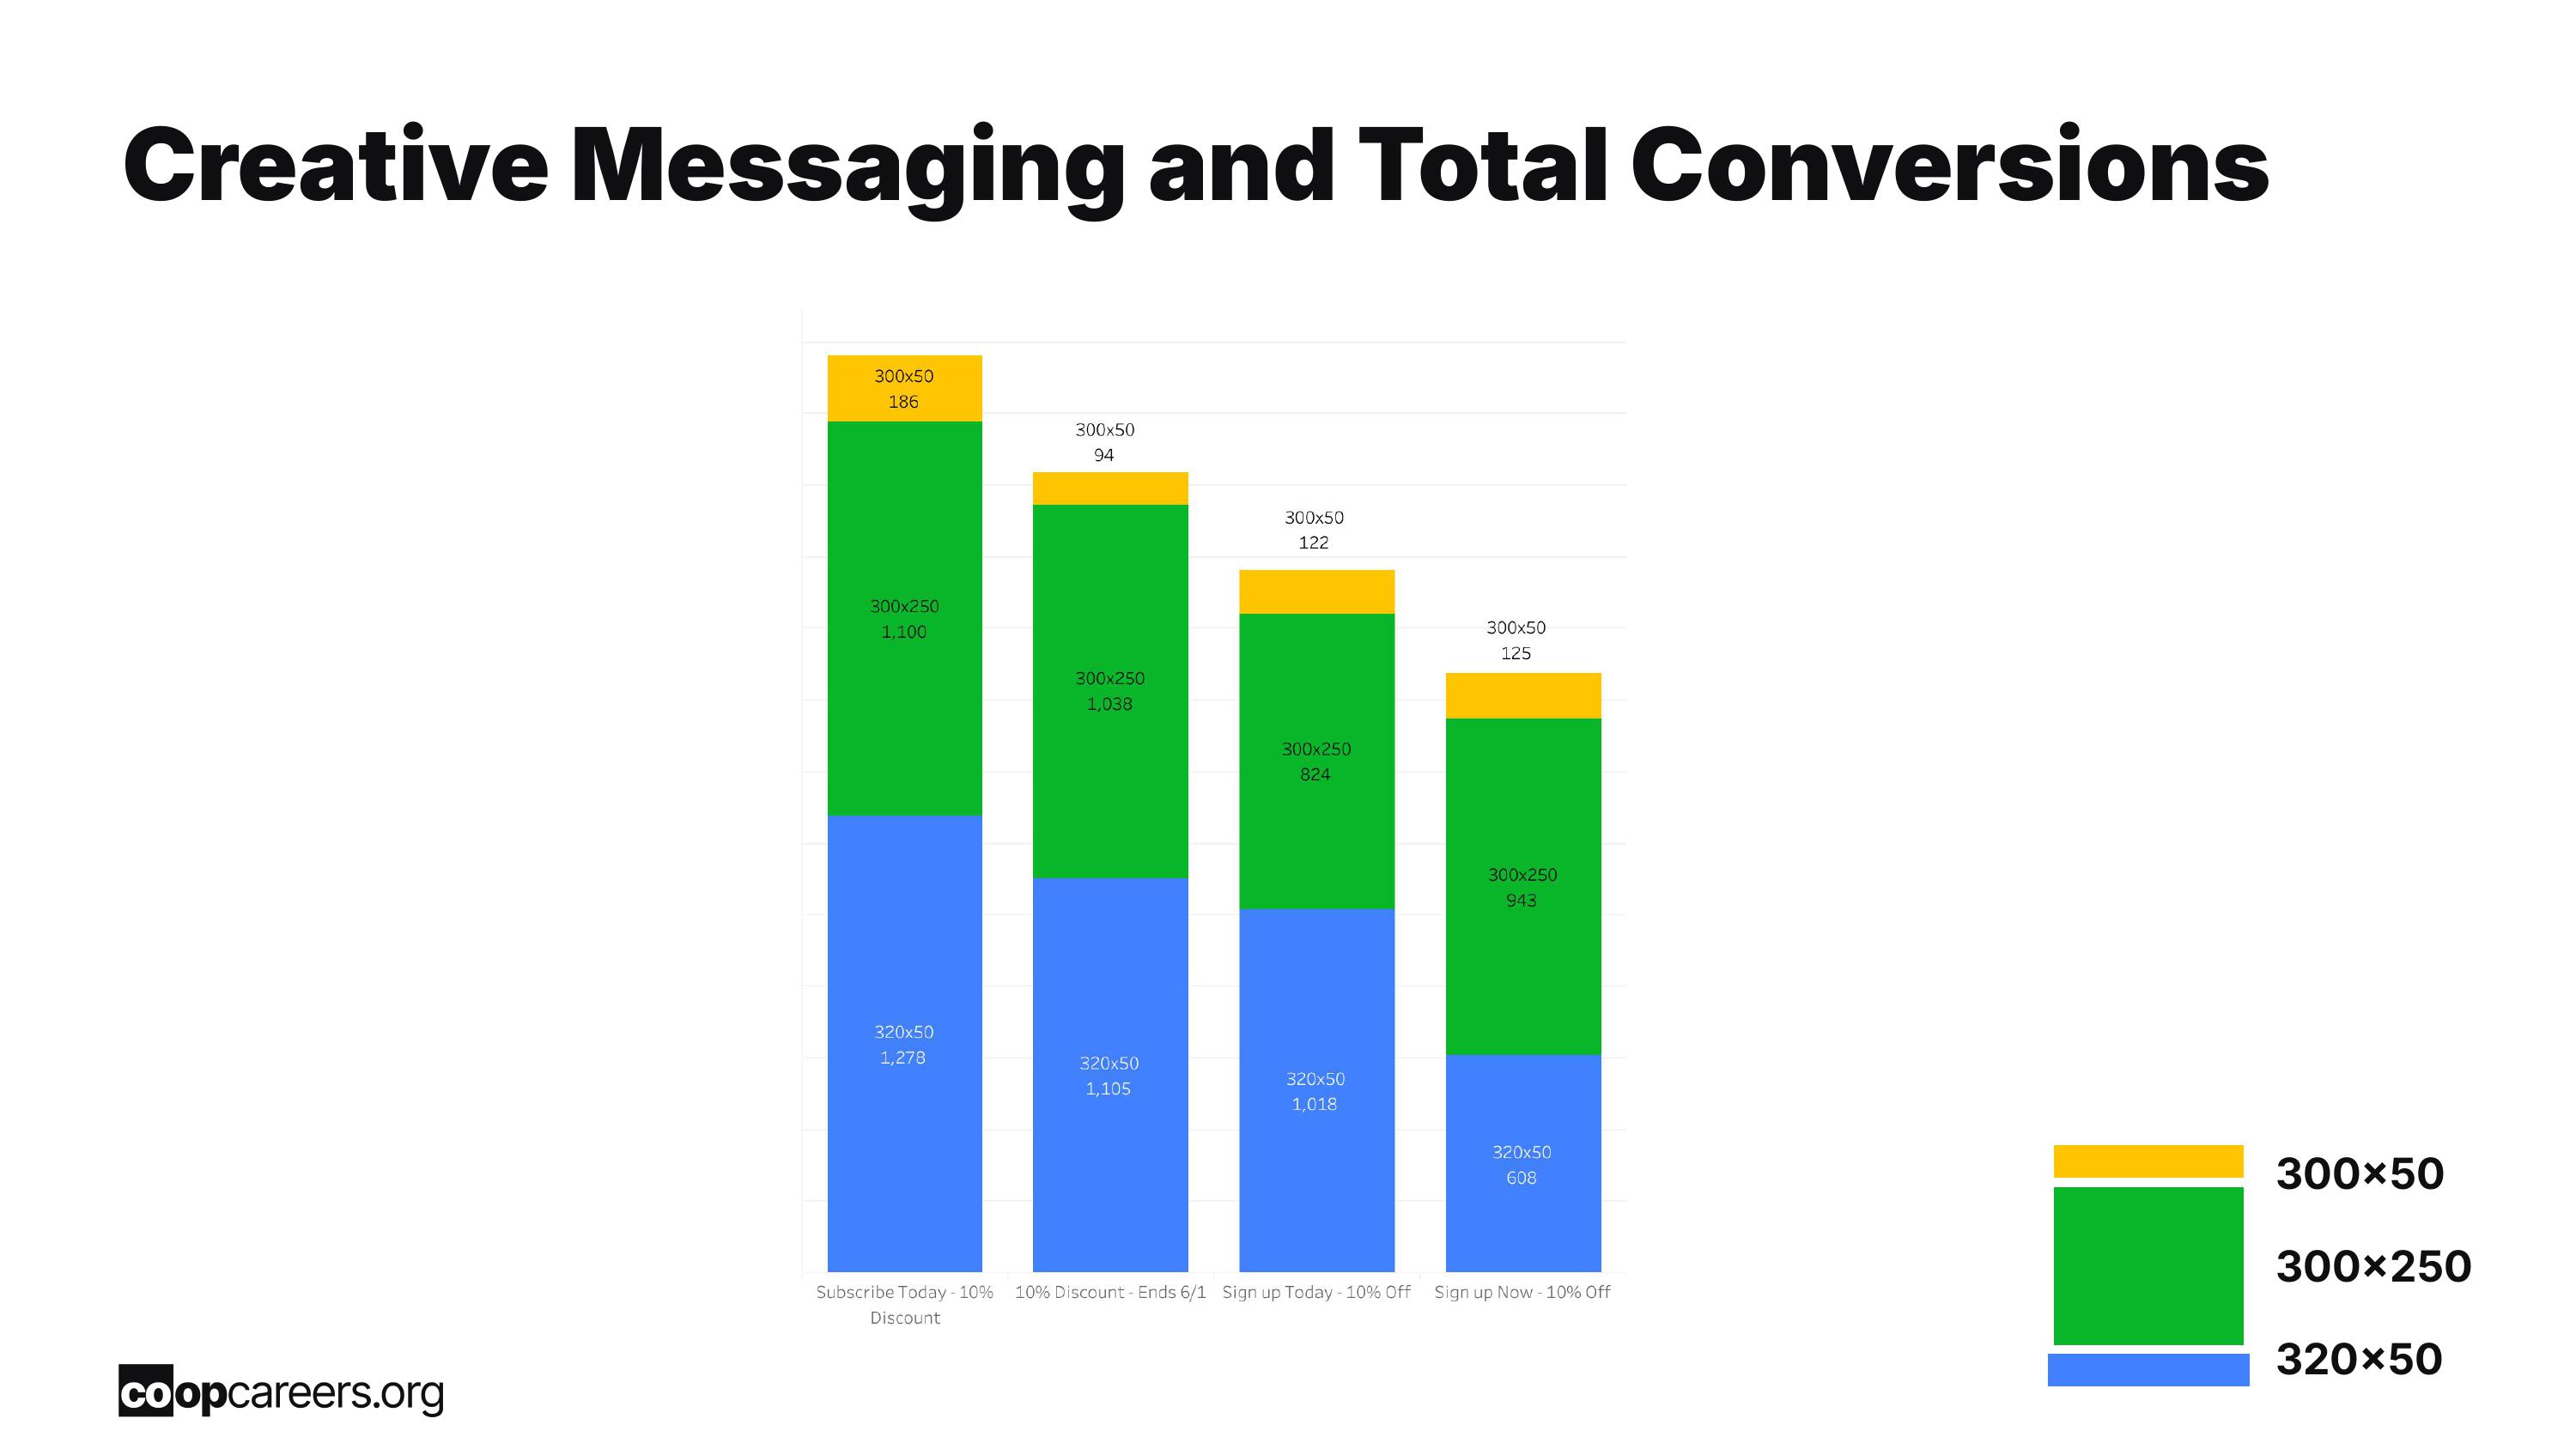
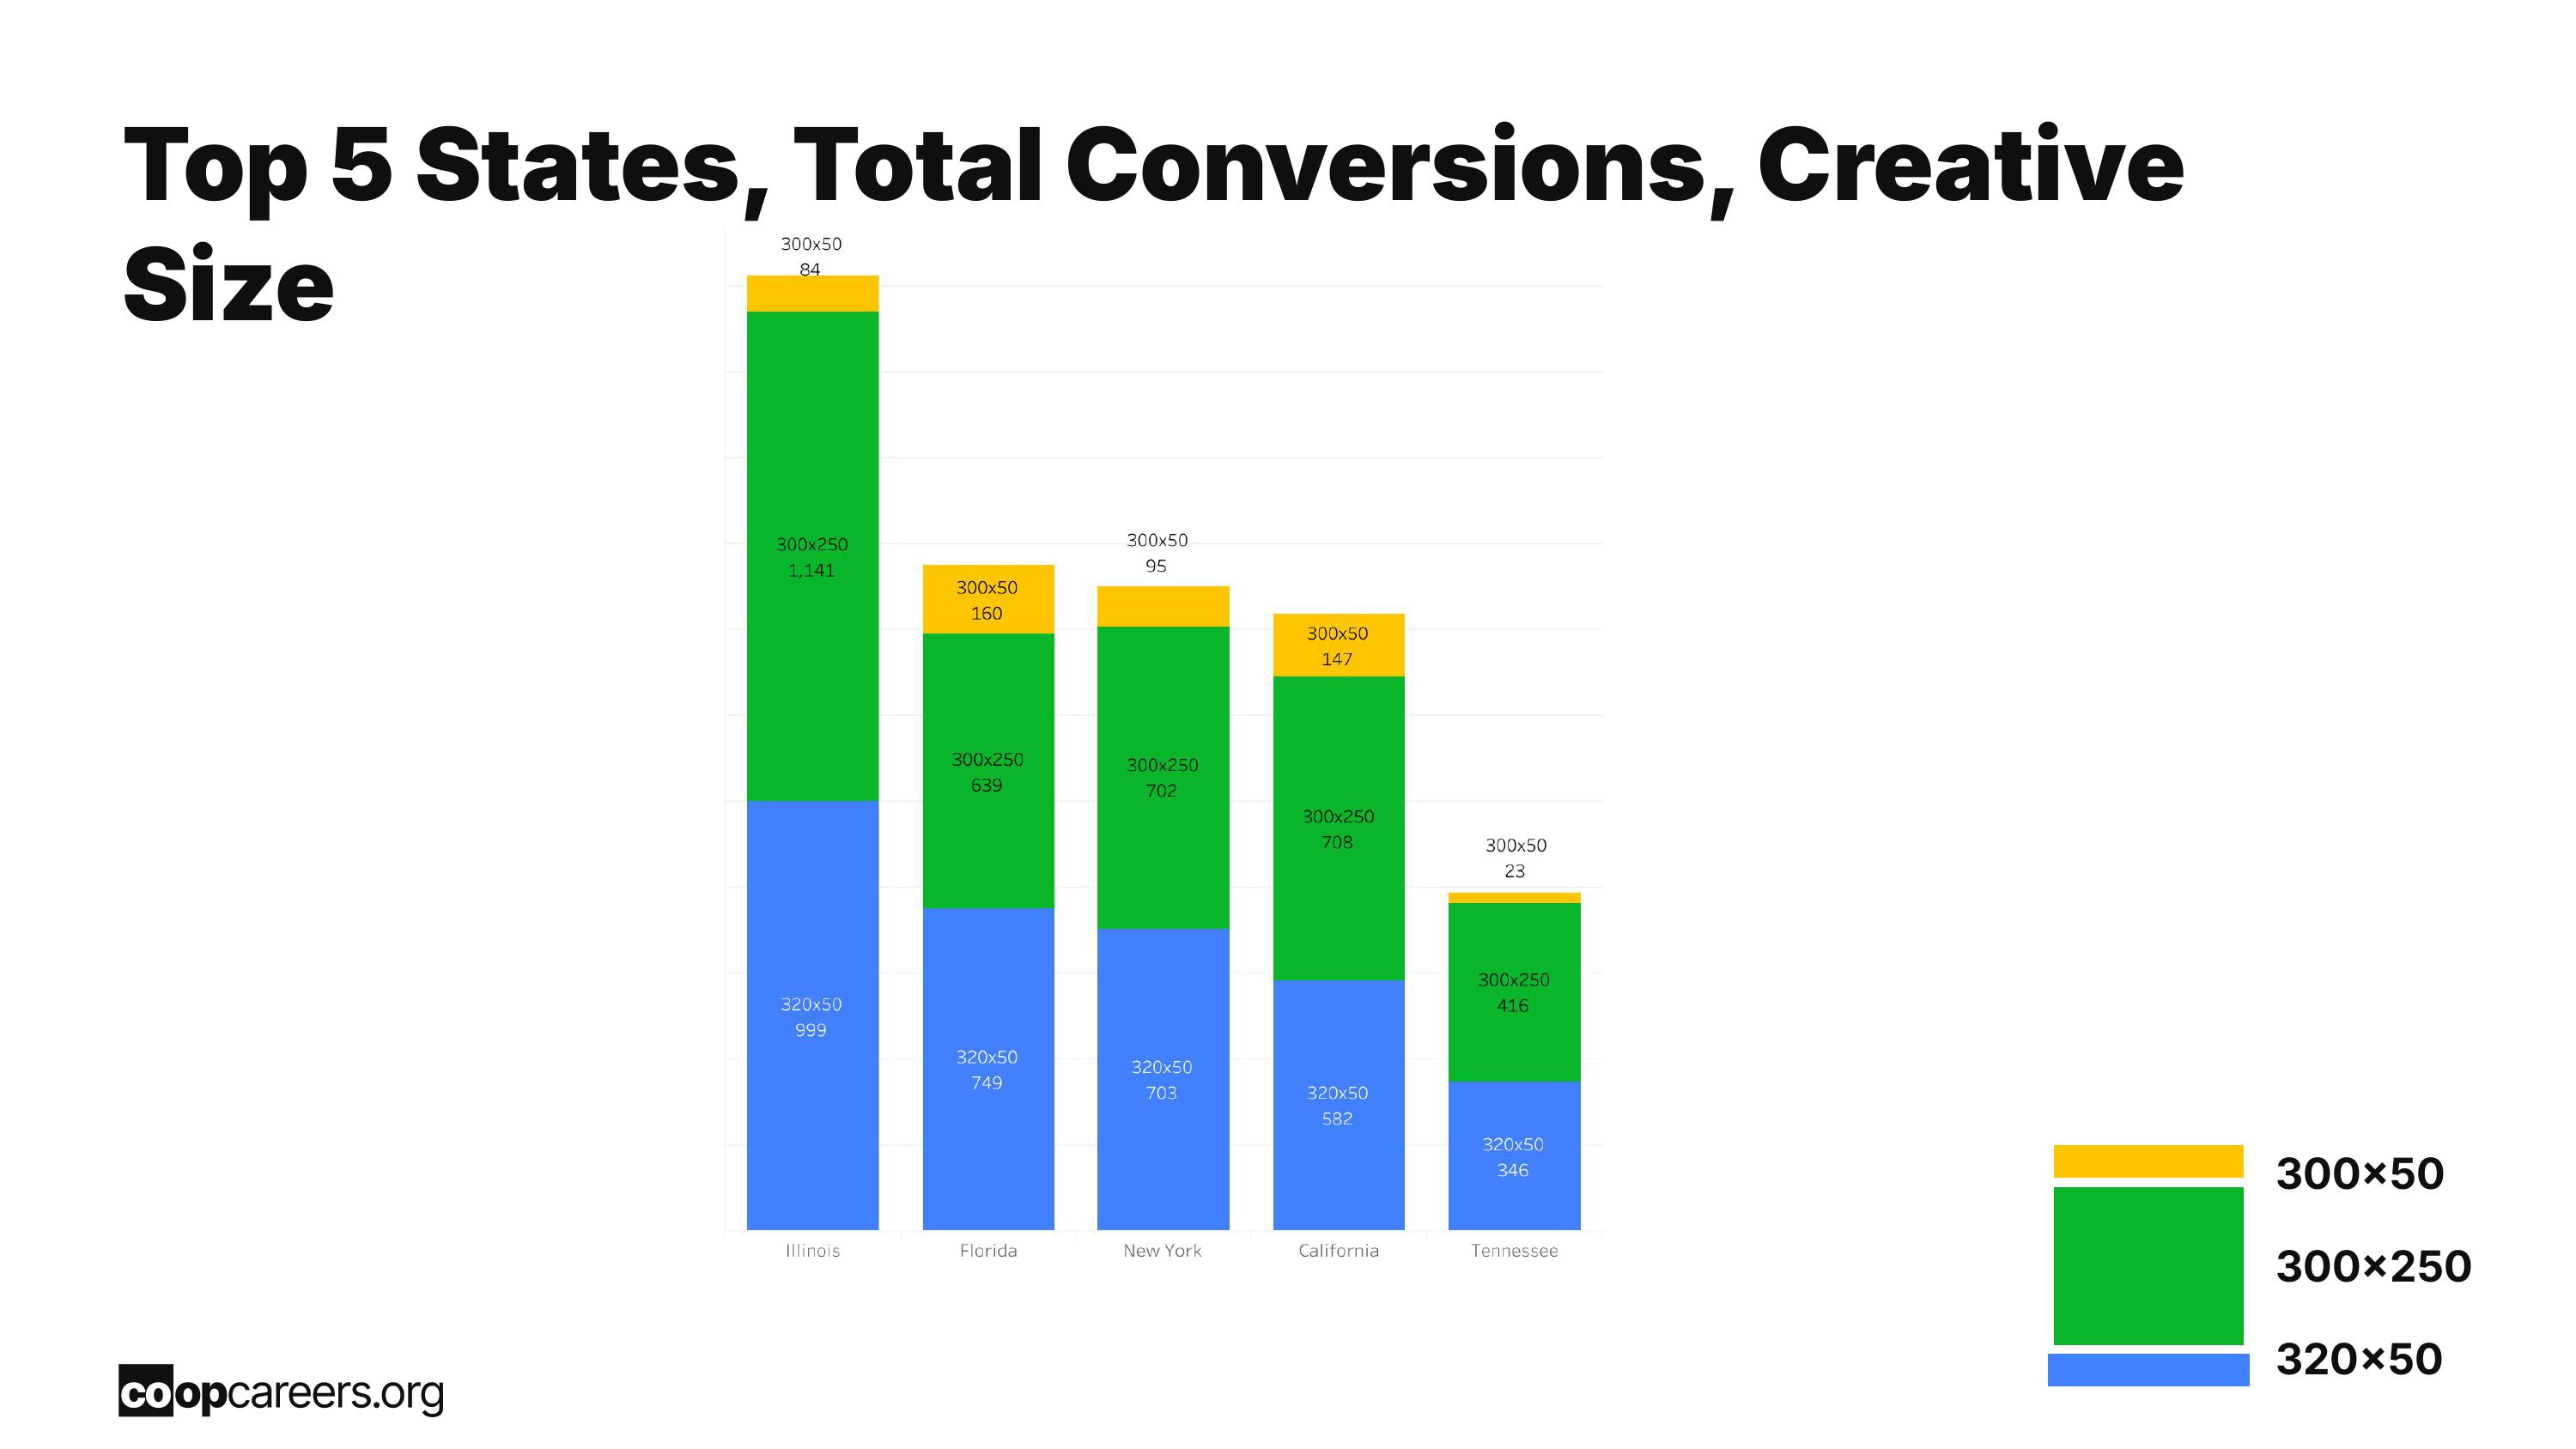
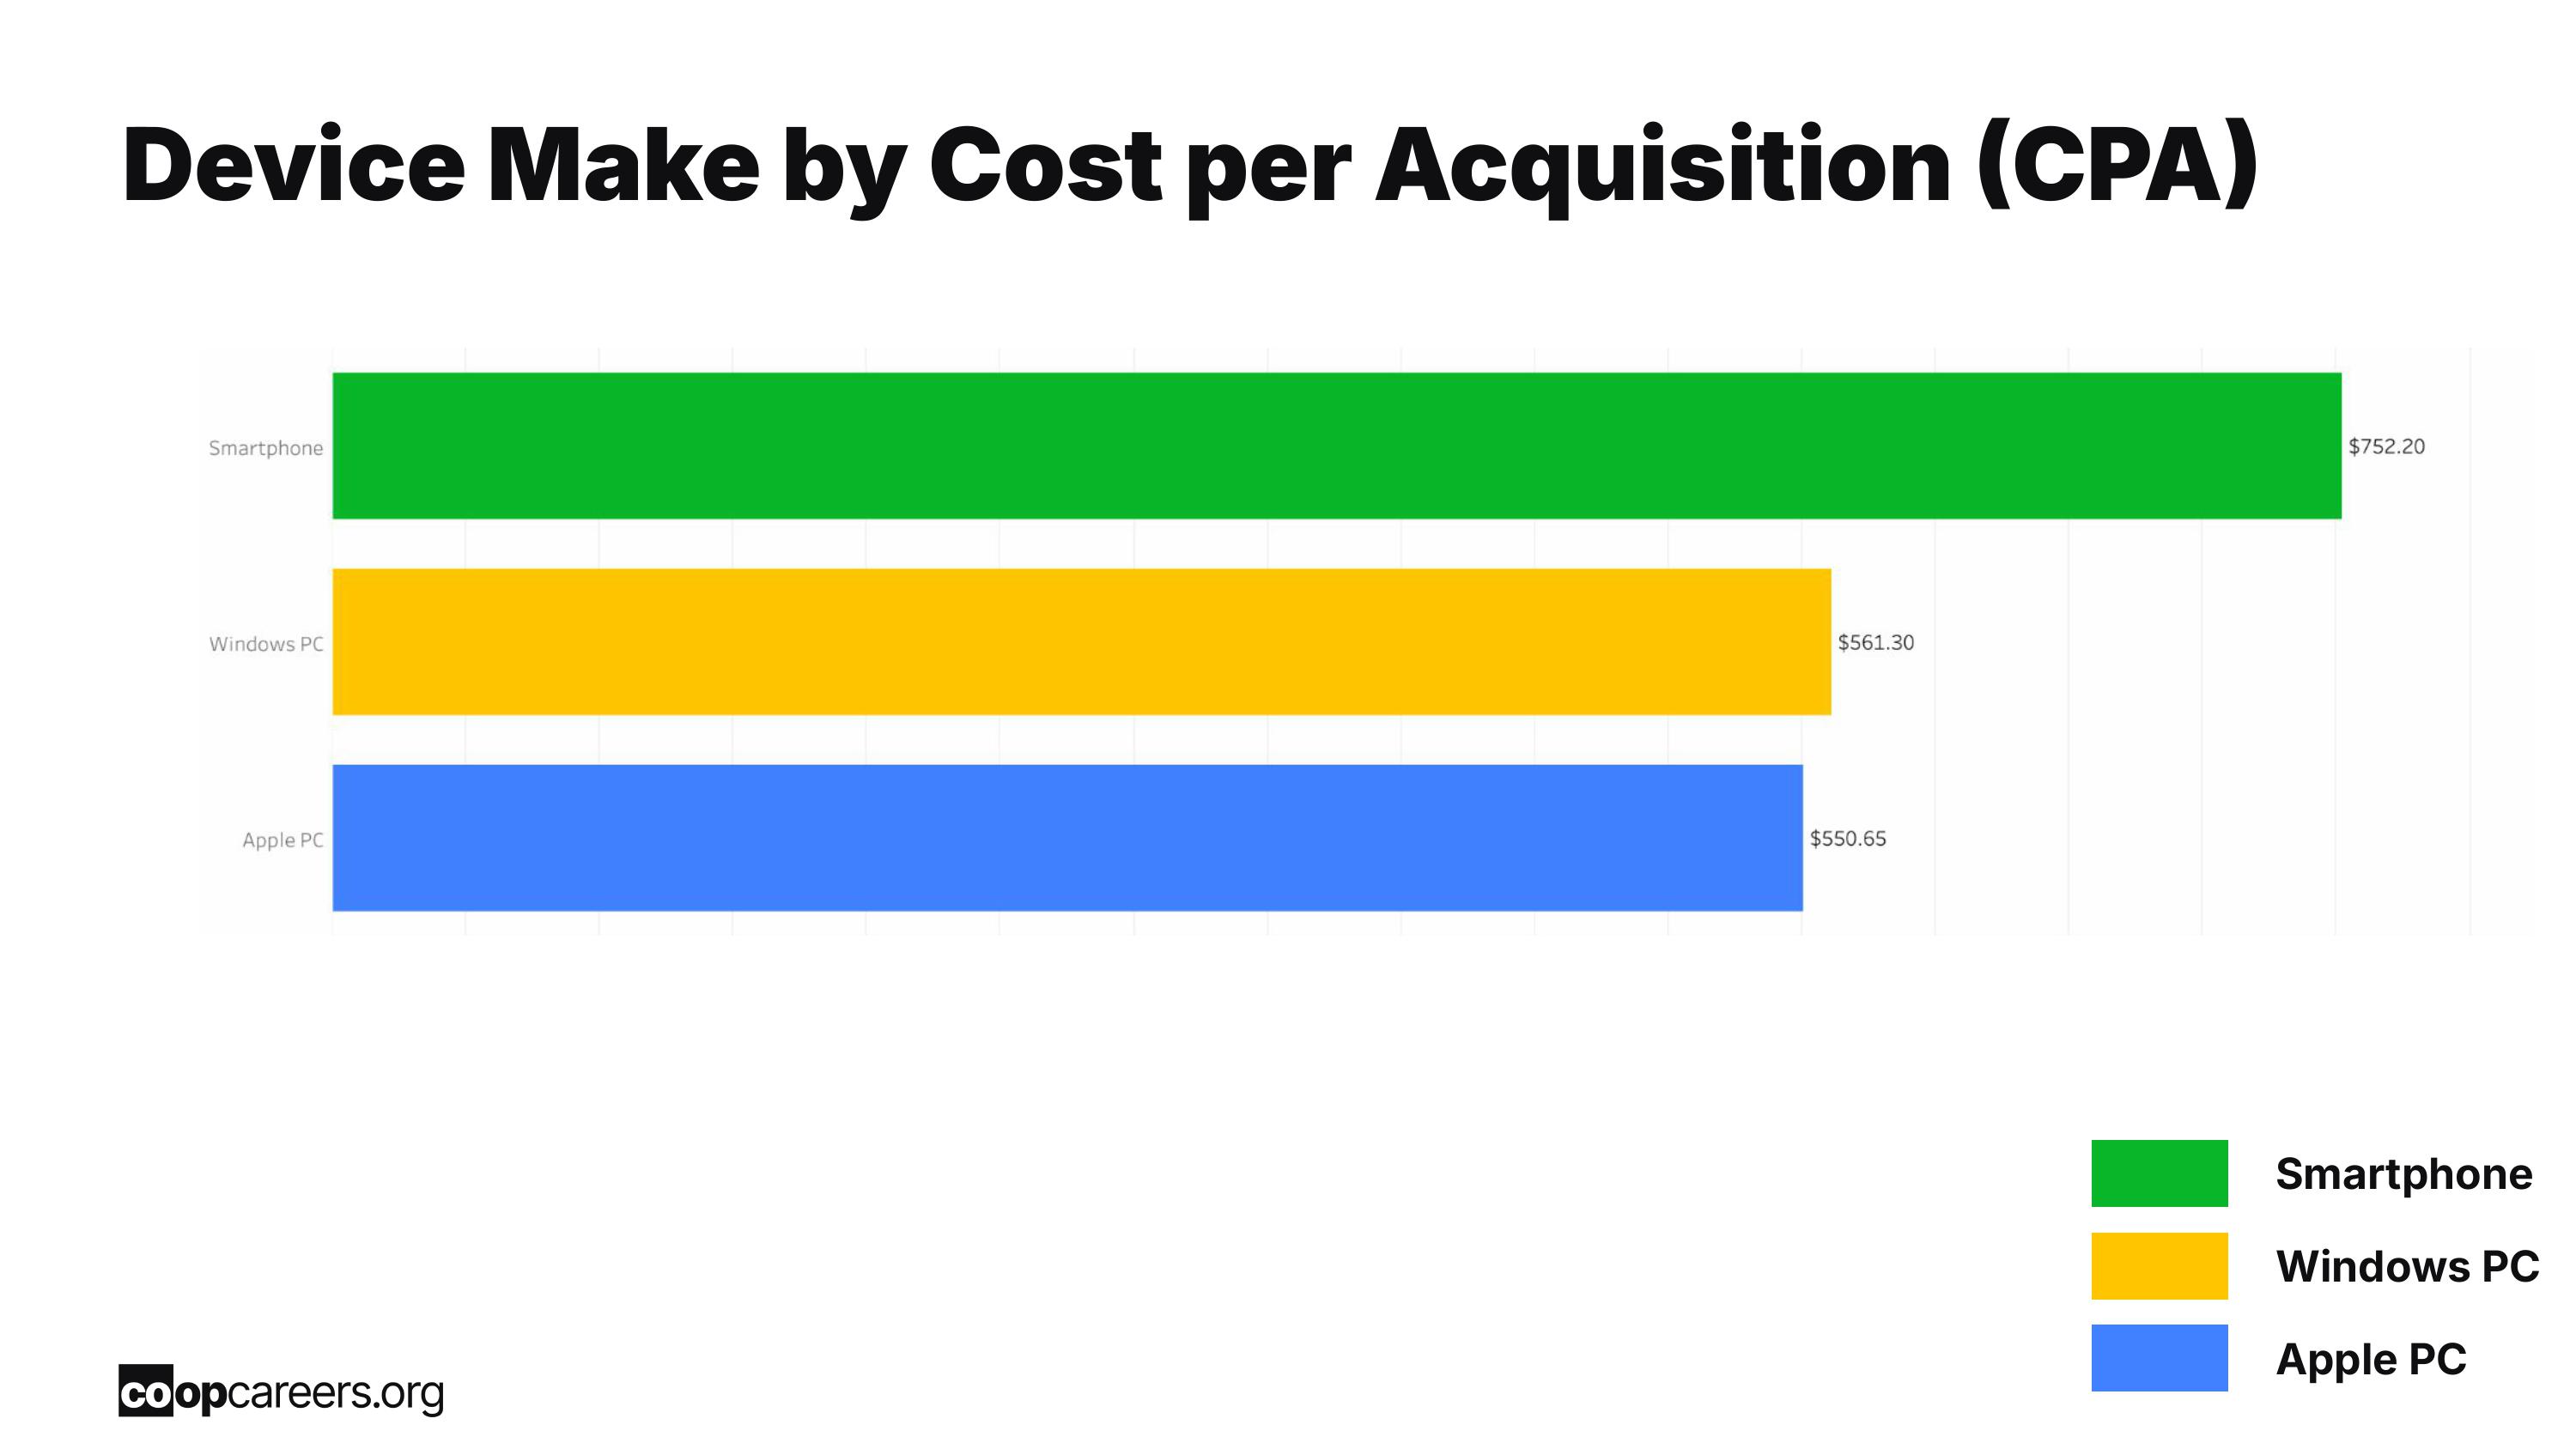
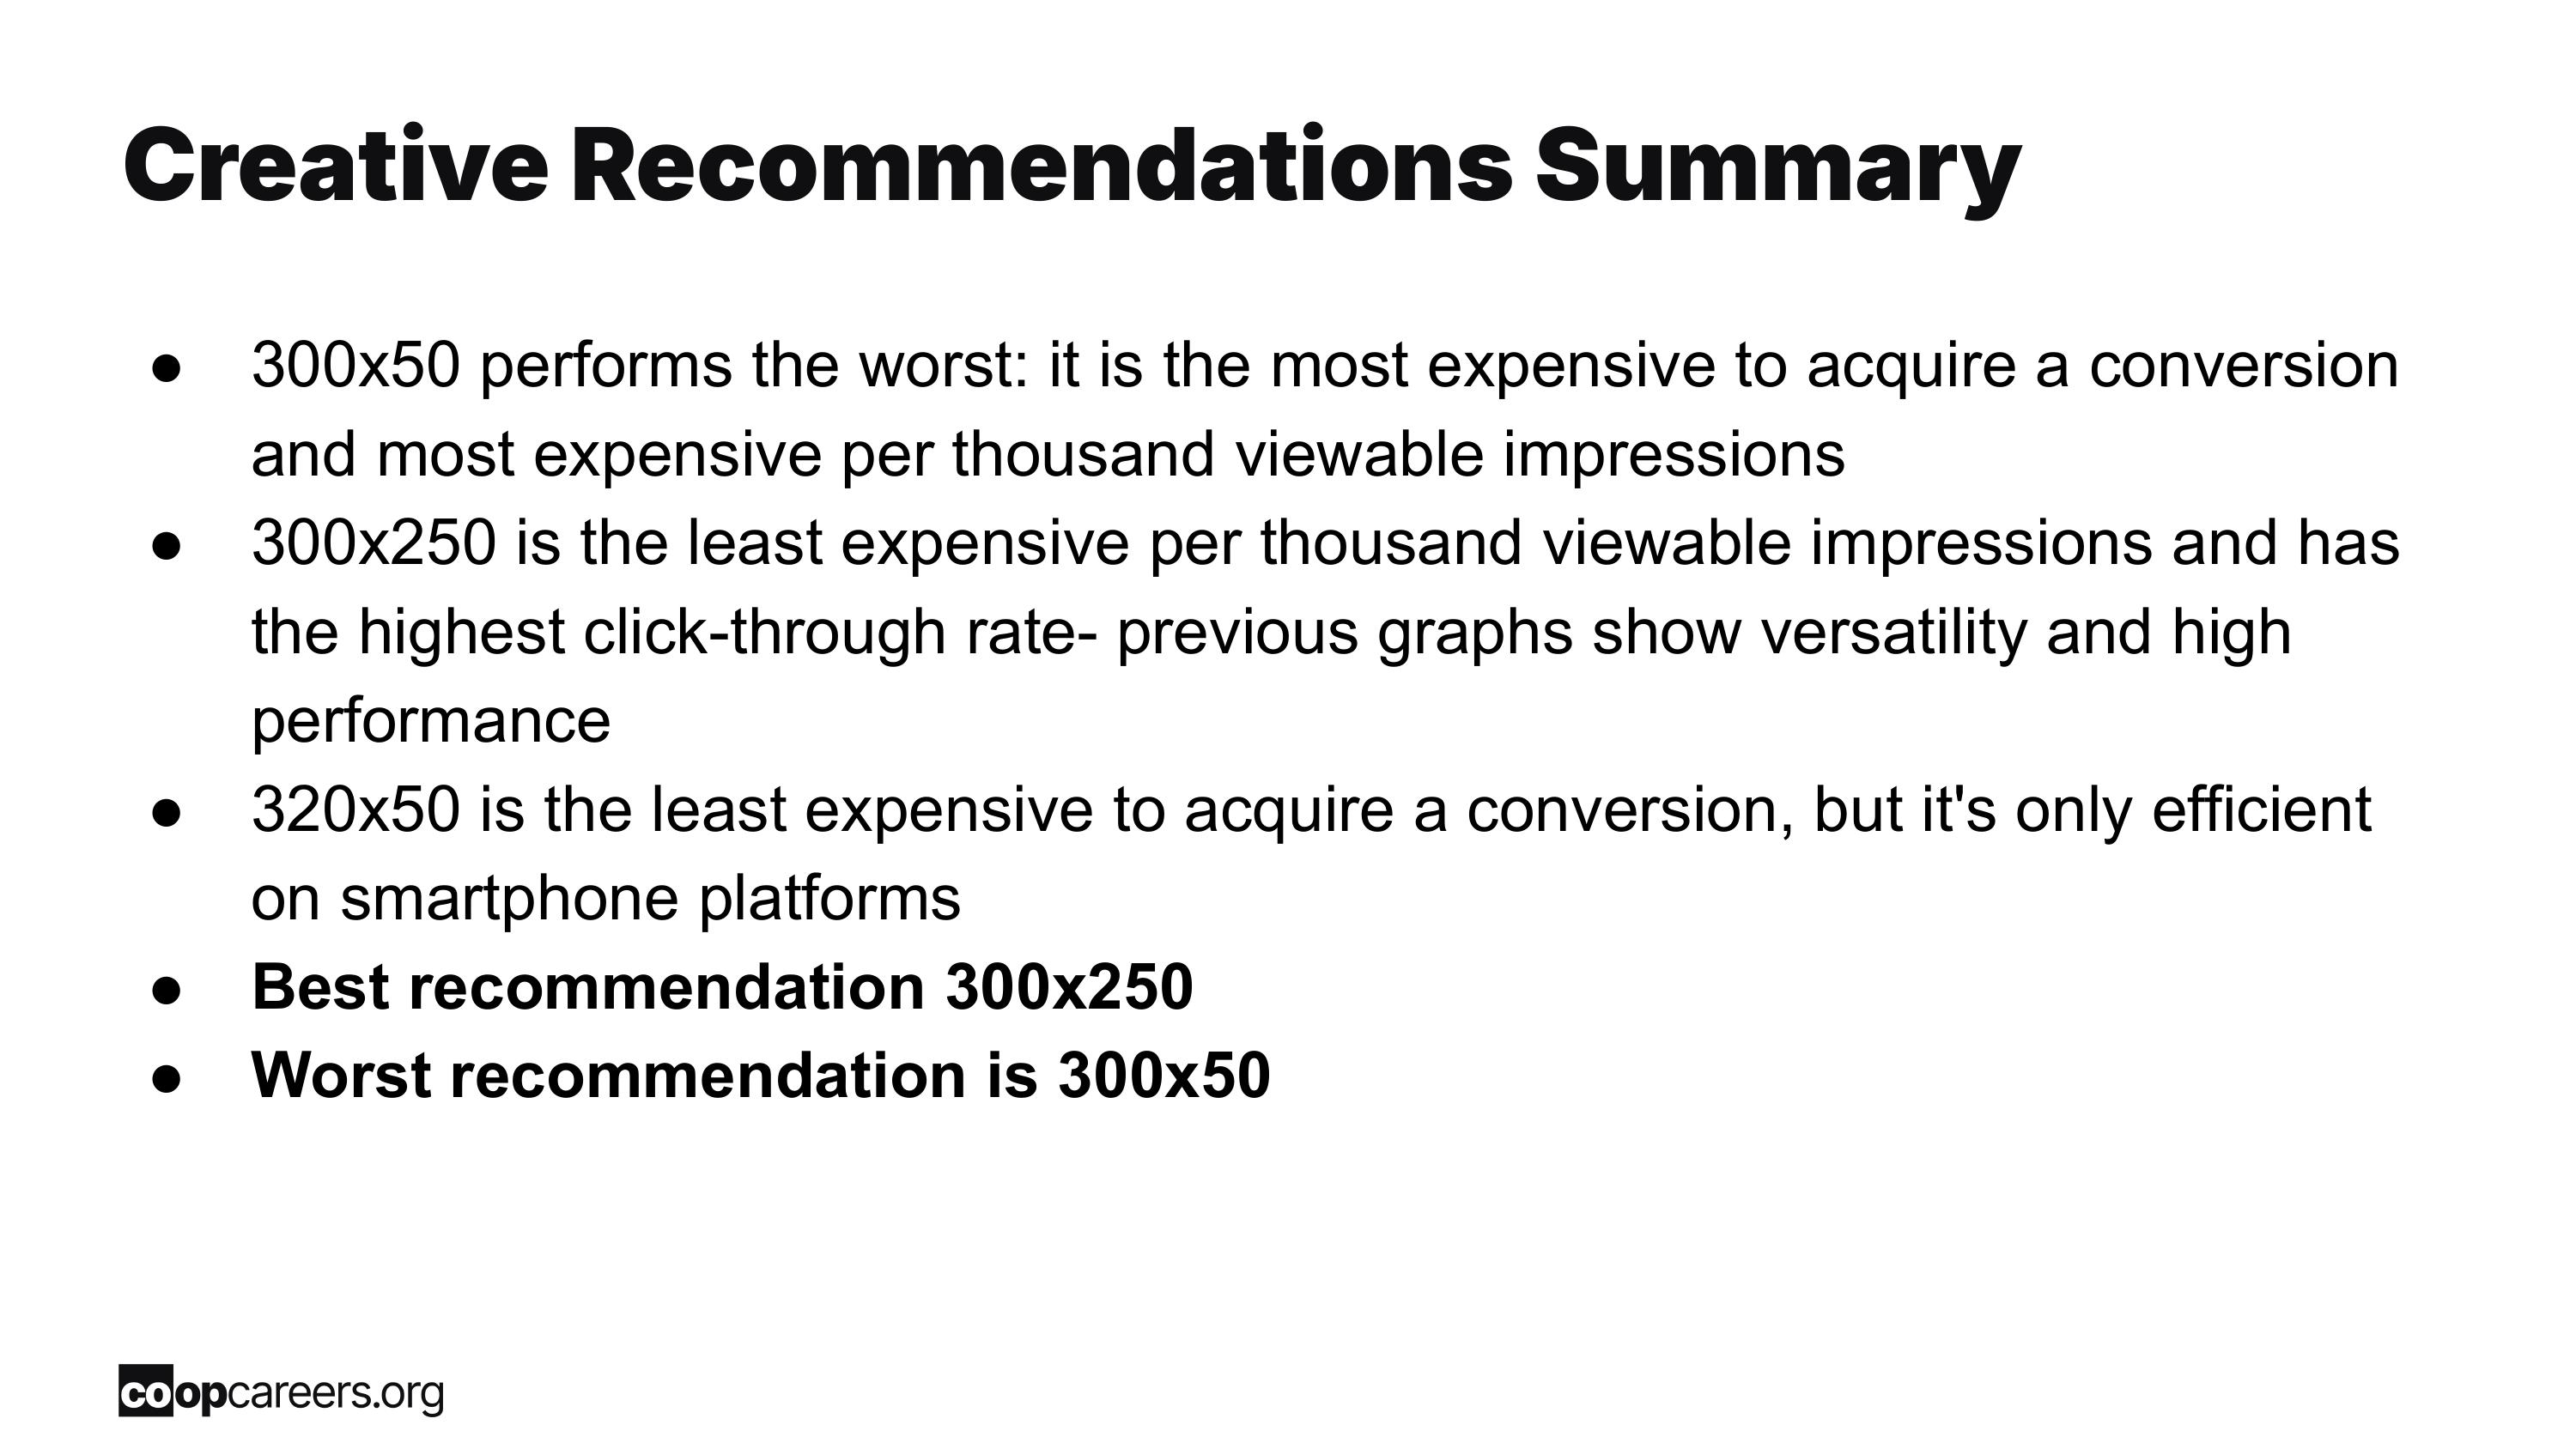
Ad sizing has a direct impact on key performance indicators (KPI) like marketing campaign clicks, conversions, and impressions. To promote a positive outcome, appropriate ad sizing is crucial for the overall campaign performance and goal completion. With this in mind, we looked at the trends between the following ad dimensions: 300x50, 300x250, and 320x50. Ad size 300x250 showed versatility across media platforms, whether smartphone, windows pc, or apple pc. It also had the greatest conversion turnout when featured on the smartphone platform. Additionally, it produced more conversions than the other sizes across all three platforms. Ad size 300x250 emerged as the most efficient dimension compared to the others in terms of conversion production and creative messaging. It is also the least expensive per thousand viewable impressions and produced the highest click-through rate. Presentation visuals showed versatility in device make and high performance in creative messaging and conversions. For these reasons, the best recommendation in terms of high marketing campaign performance amongst viewers is ad size 300x250.Inventory Analysis
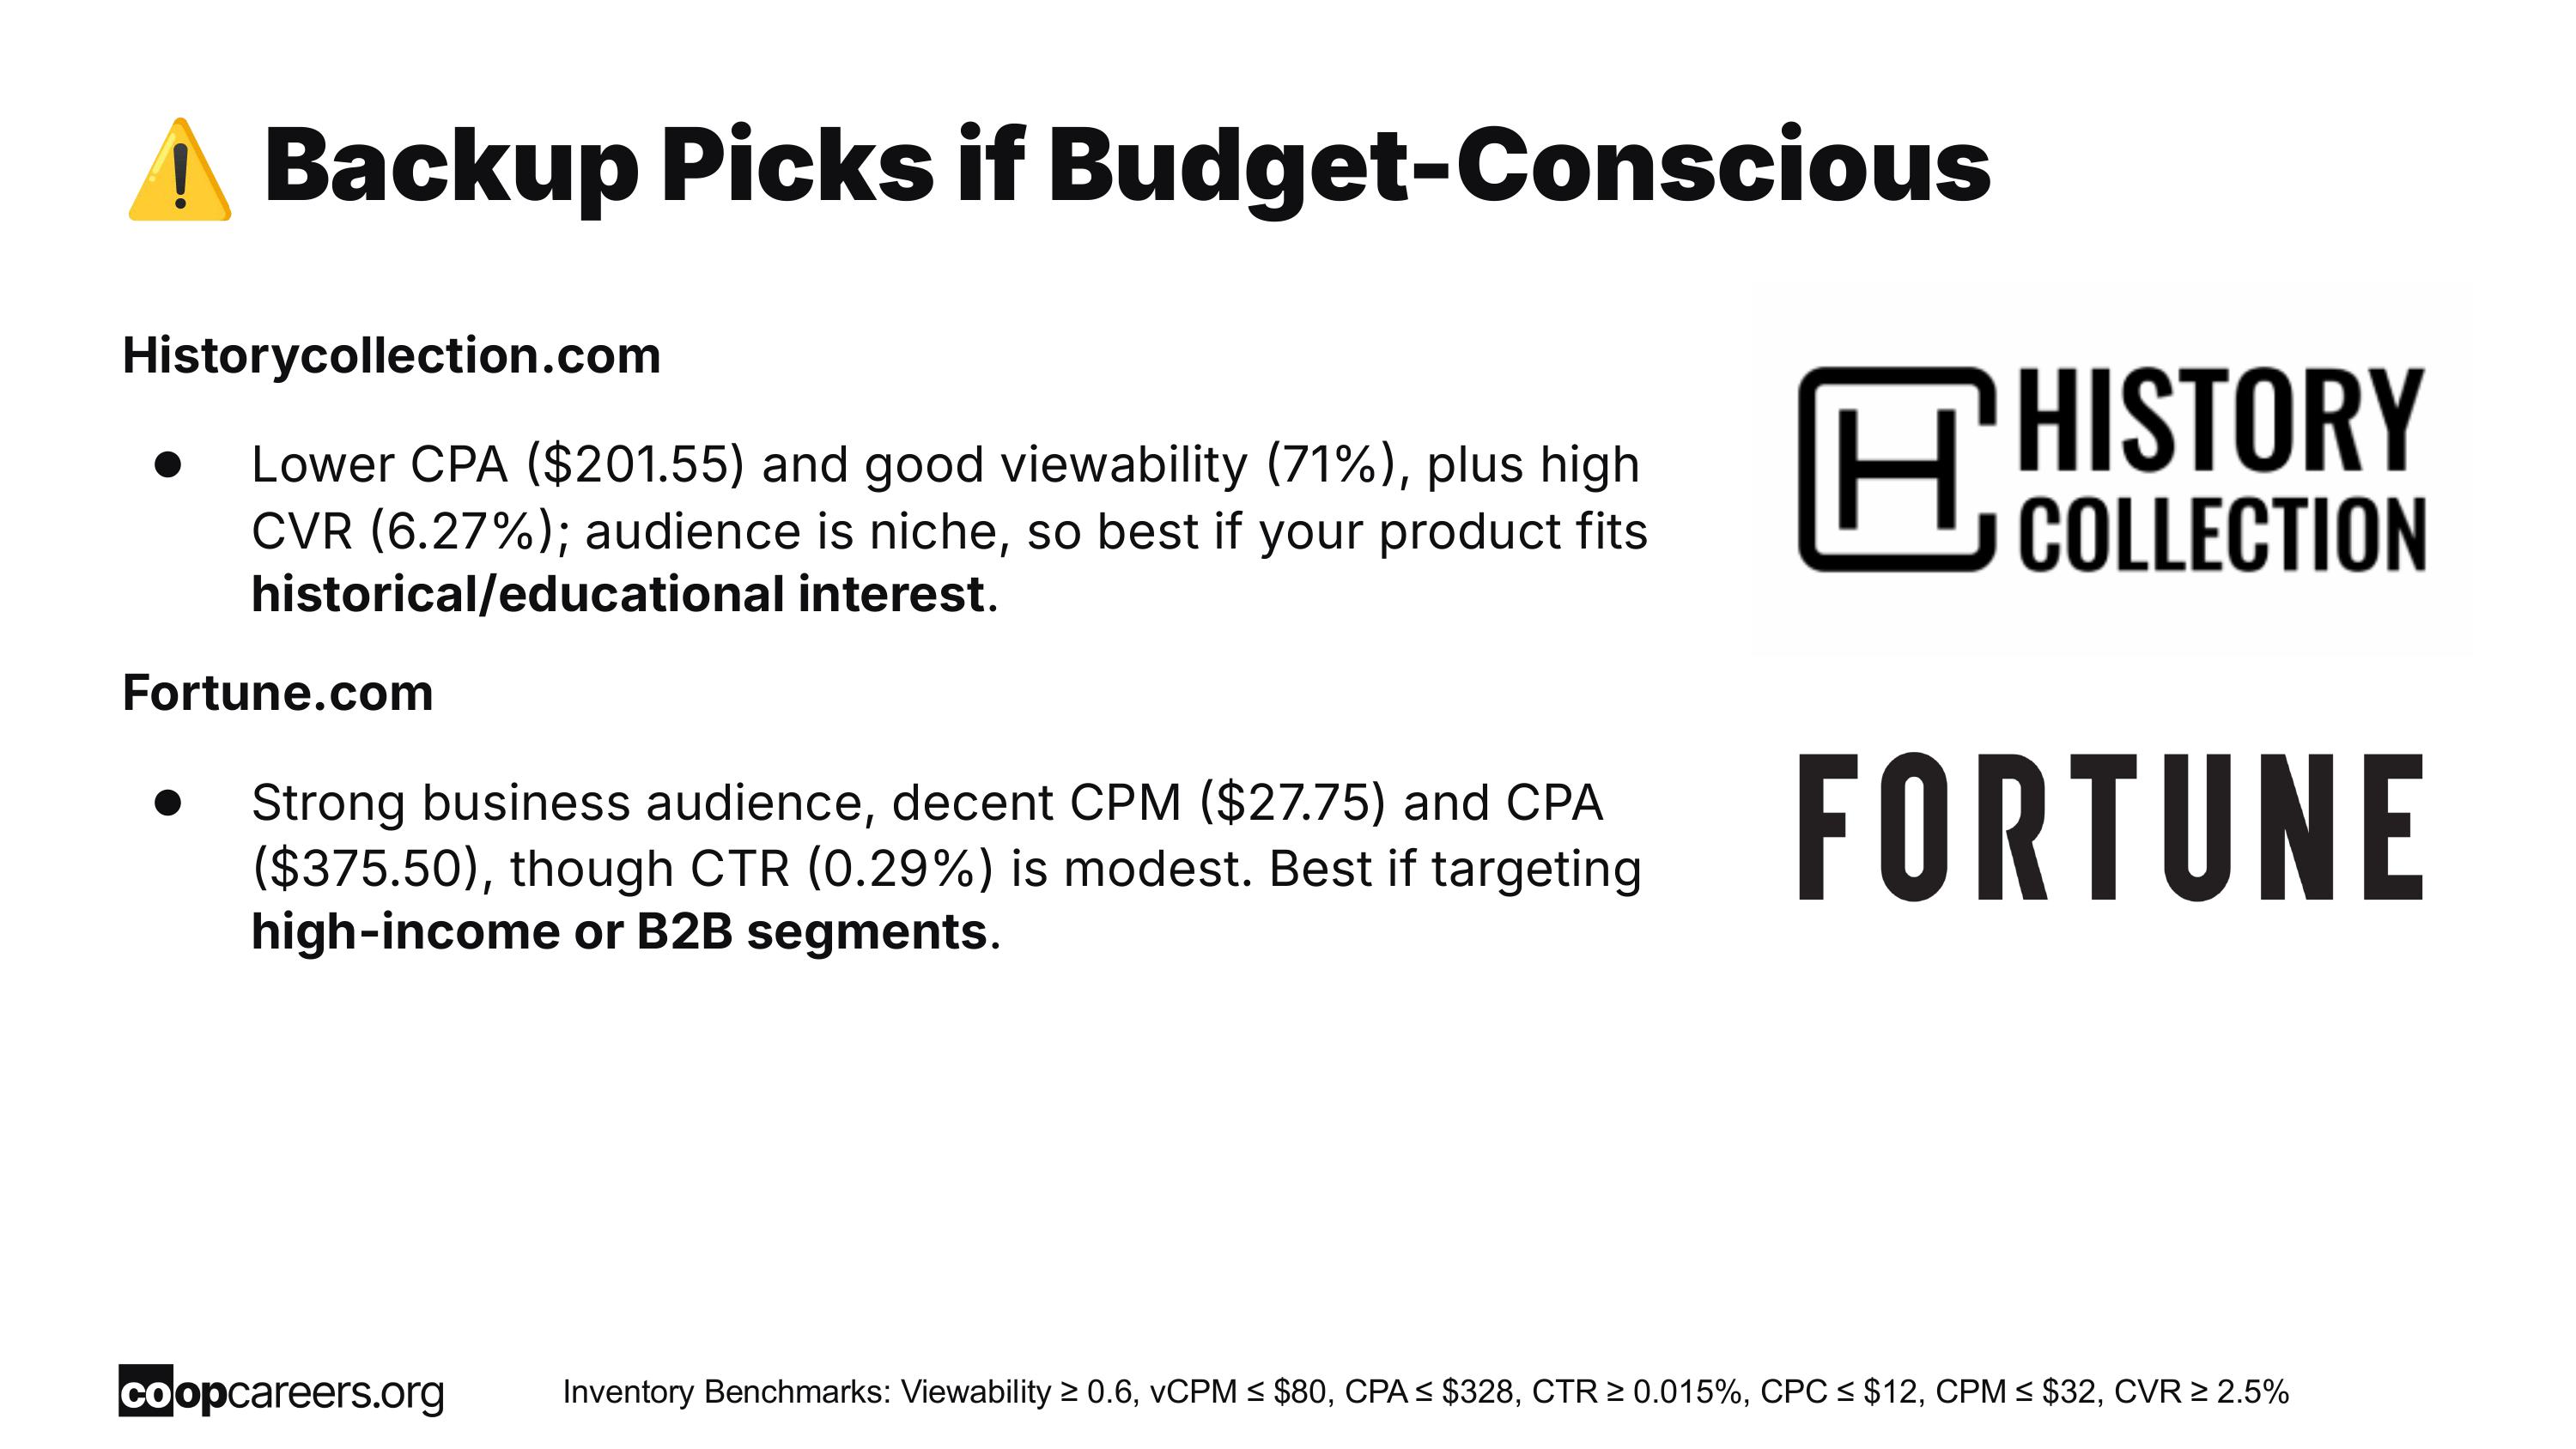
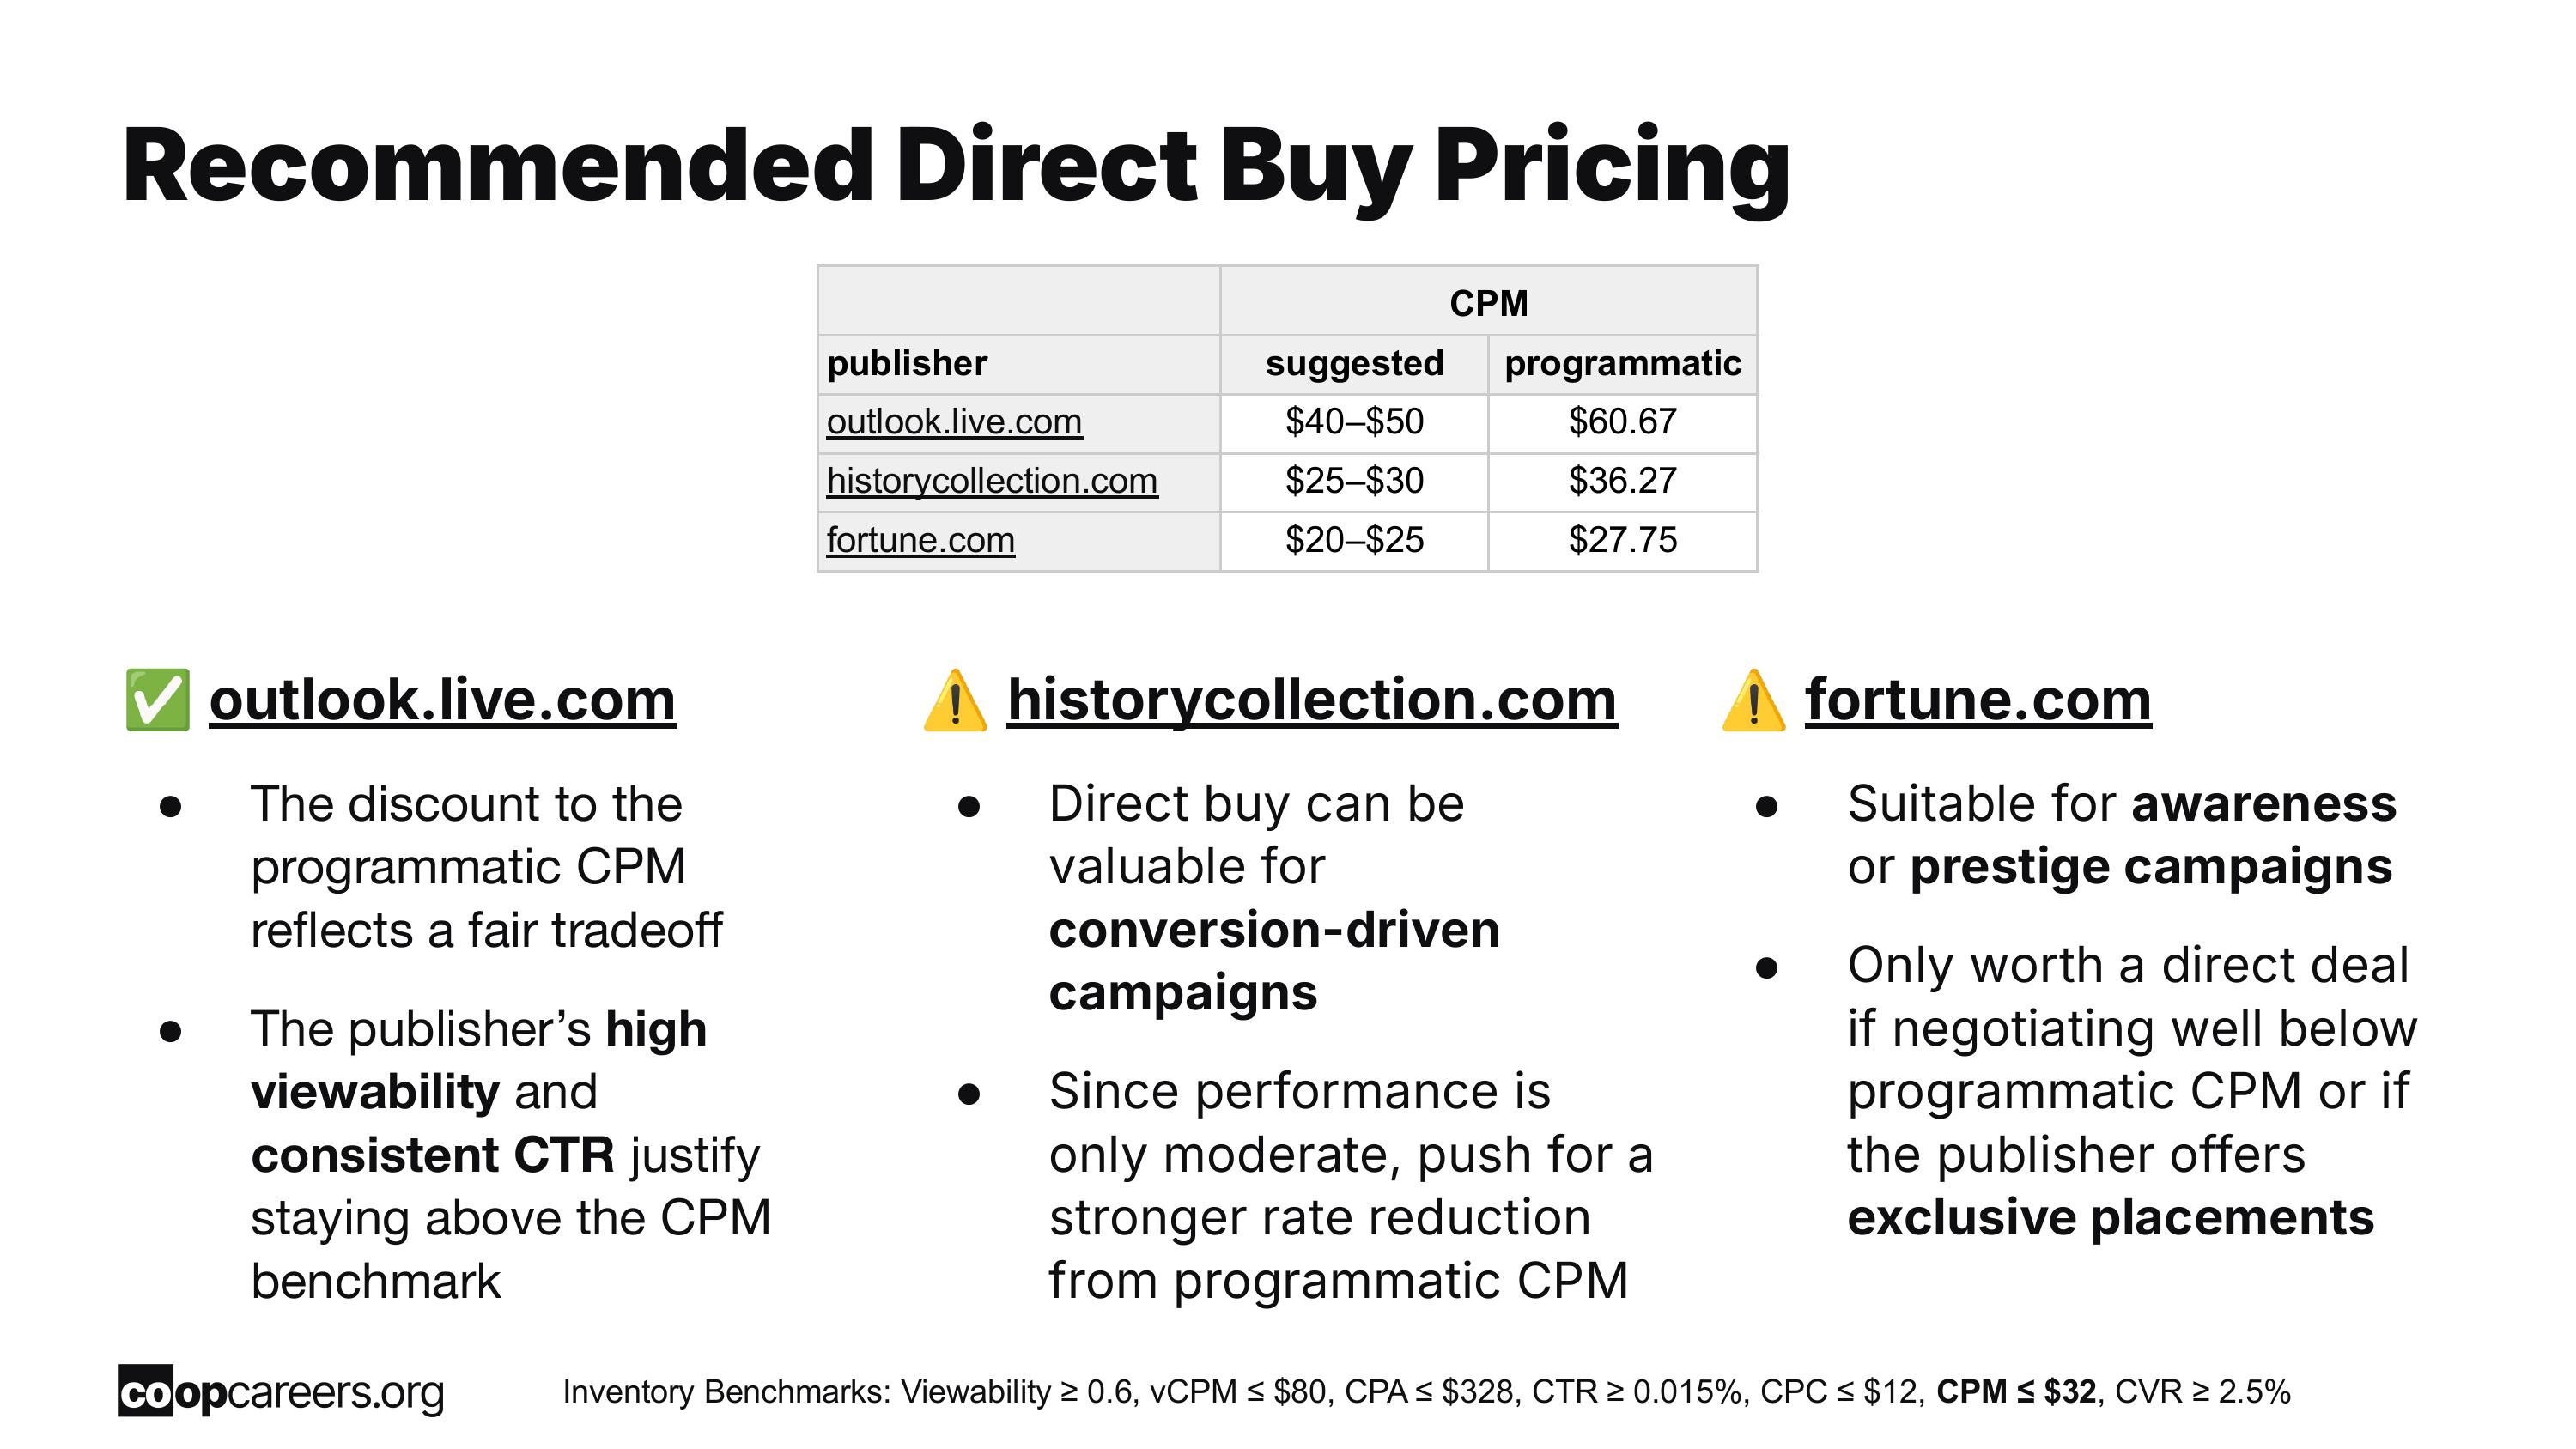
Based on our analysis, Kargo was the best exchange based on performance. It has fantastic CTR and CPA, but it’s expensive. Sovrn, Taboola, and Gumgum would be good alternatives based on engagement. Although the viewability rate does not meet the goal. The top-performing publisher in this dataset is historycollection.com, with a balanced performance all around. While outlook.live.com has better performance, its CPA is quite high. Great alternatives are fortune.com because of its solid metrics, or taboolanews.com and mobilepossee.com because most metrics meet the benchmark, but would need to consider their low viewability. The top choice for direct buy is outlook.live.com because of its consistent performance across different exchanges. outlook.live.com offers high viewability, strong engagement, guaranteed inventory, and brand safety, so a suggested direct buy CPM rate of $40–$50 (above benchmark) is justified. Good backup choices would be historycollection.com, for niche ads and conversion-driven campaigns for a CPM rate of $25–$30, and fortune.com for brand awareness and prestige campaigns for a CPM rate of $20–$25.A24’s Next Film
Fellowship Mid-Cycle Project


︎︎︎Tableau
The Team
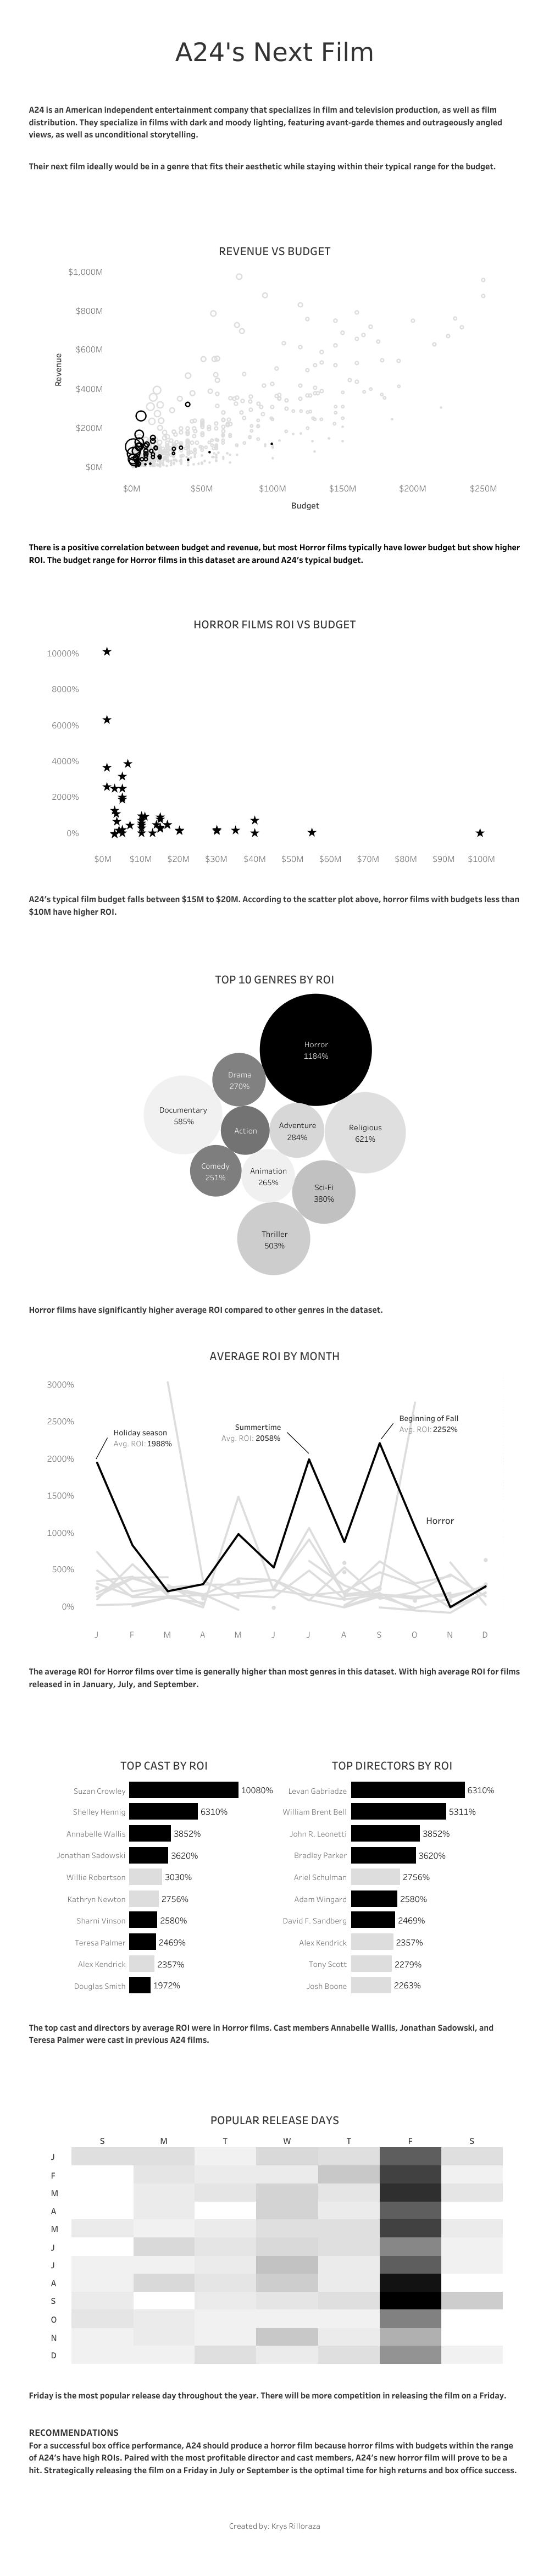
Krys Rilloraza, Cindy Celedonio, Kabelo Muhammad, and Ramon Quinto.The Business Task
Step into the shoes of data consultants for A24 to analyze box office performance data to help them decide the direction of their next film project.Key Insights
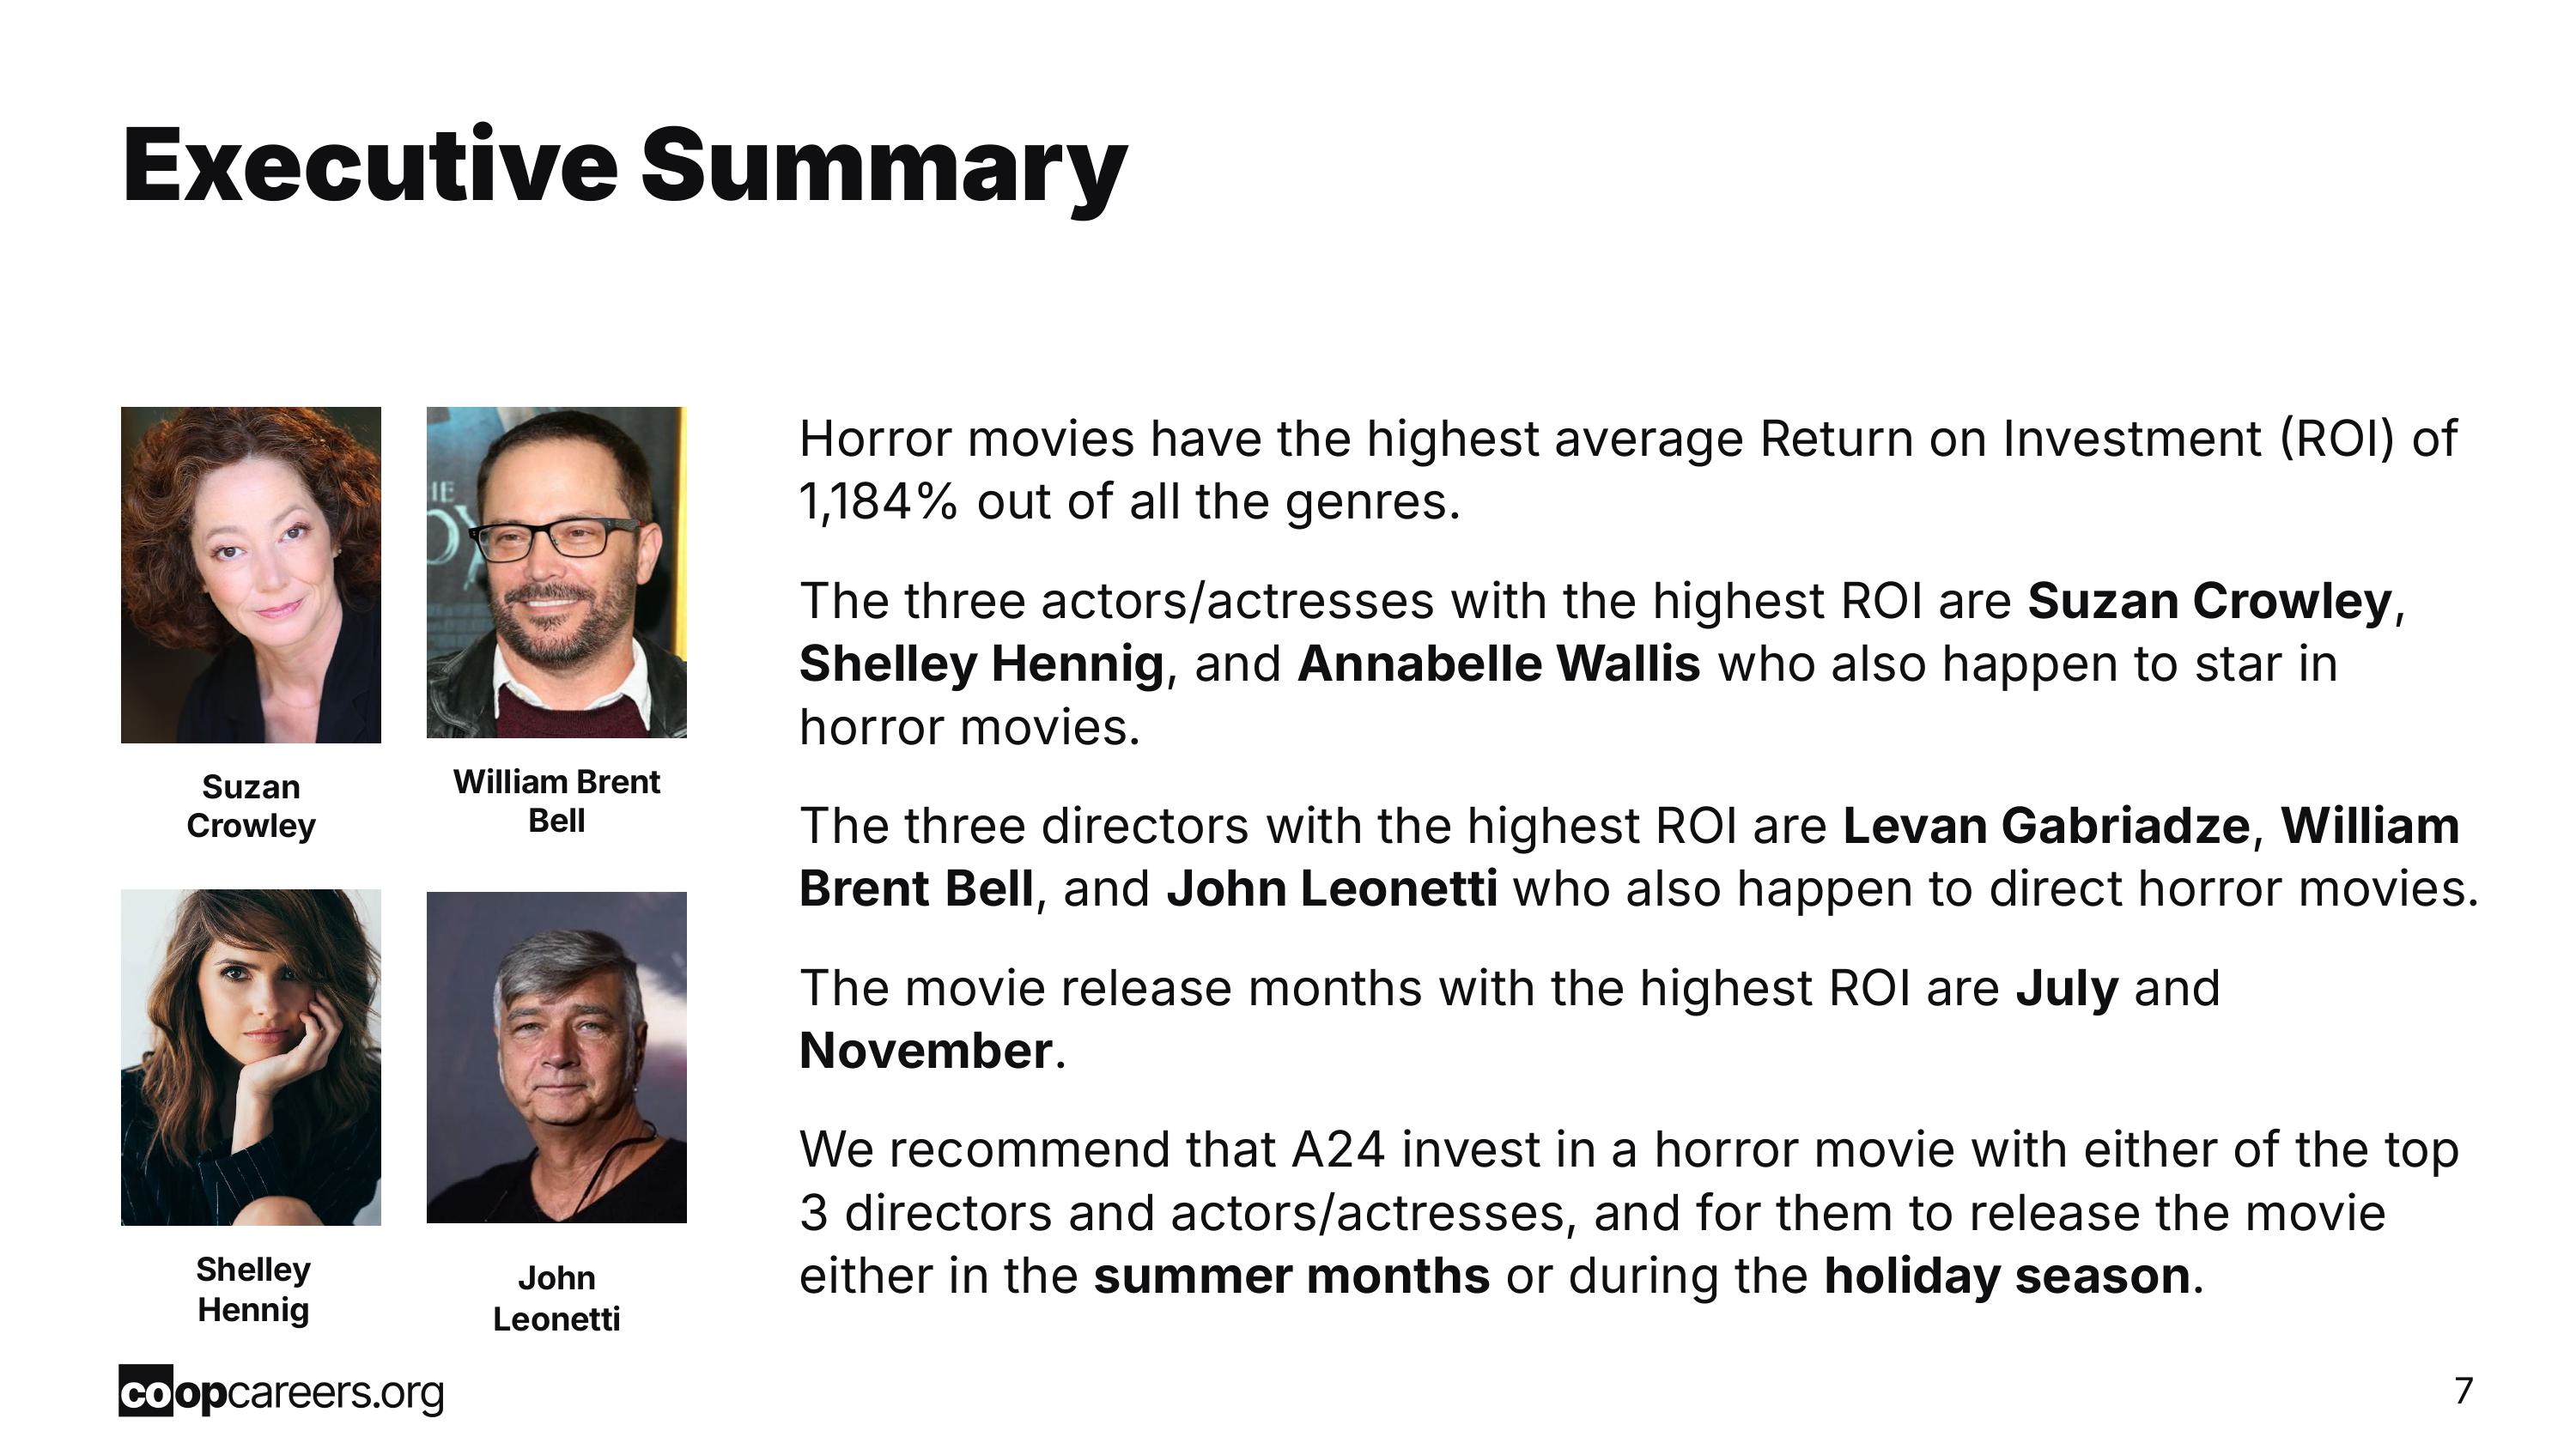
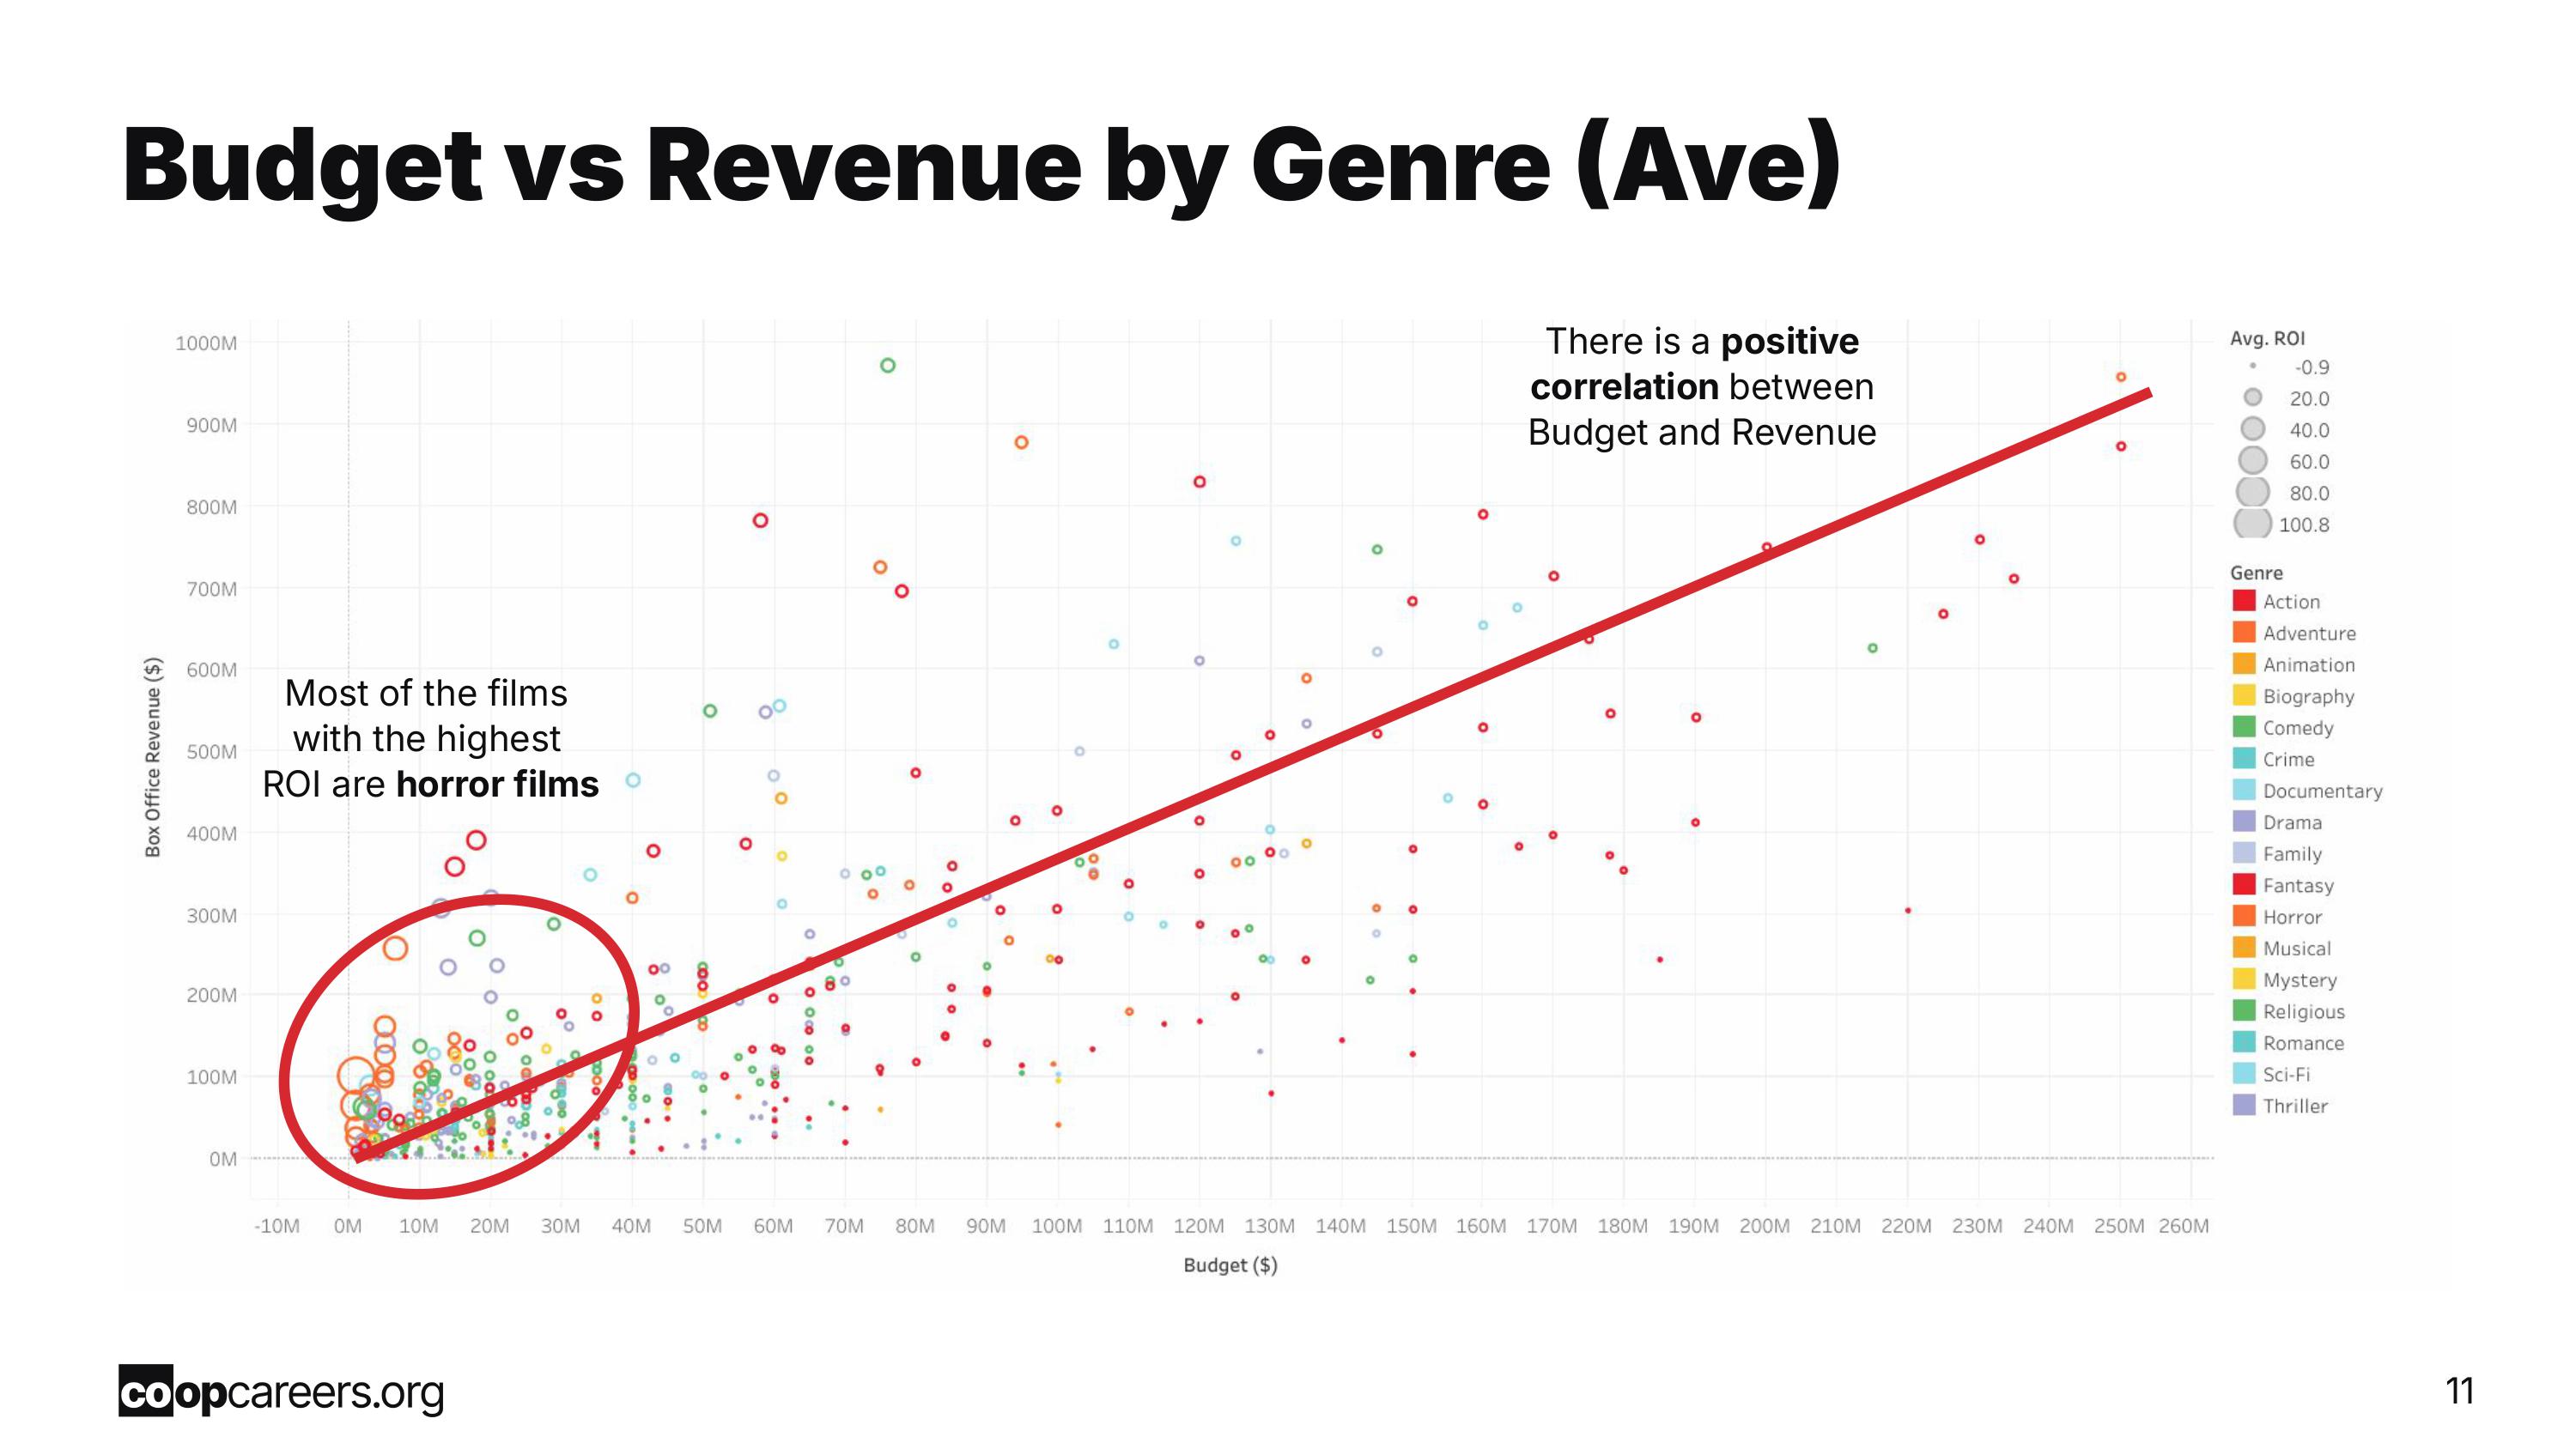
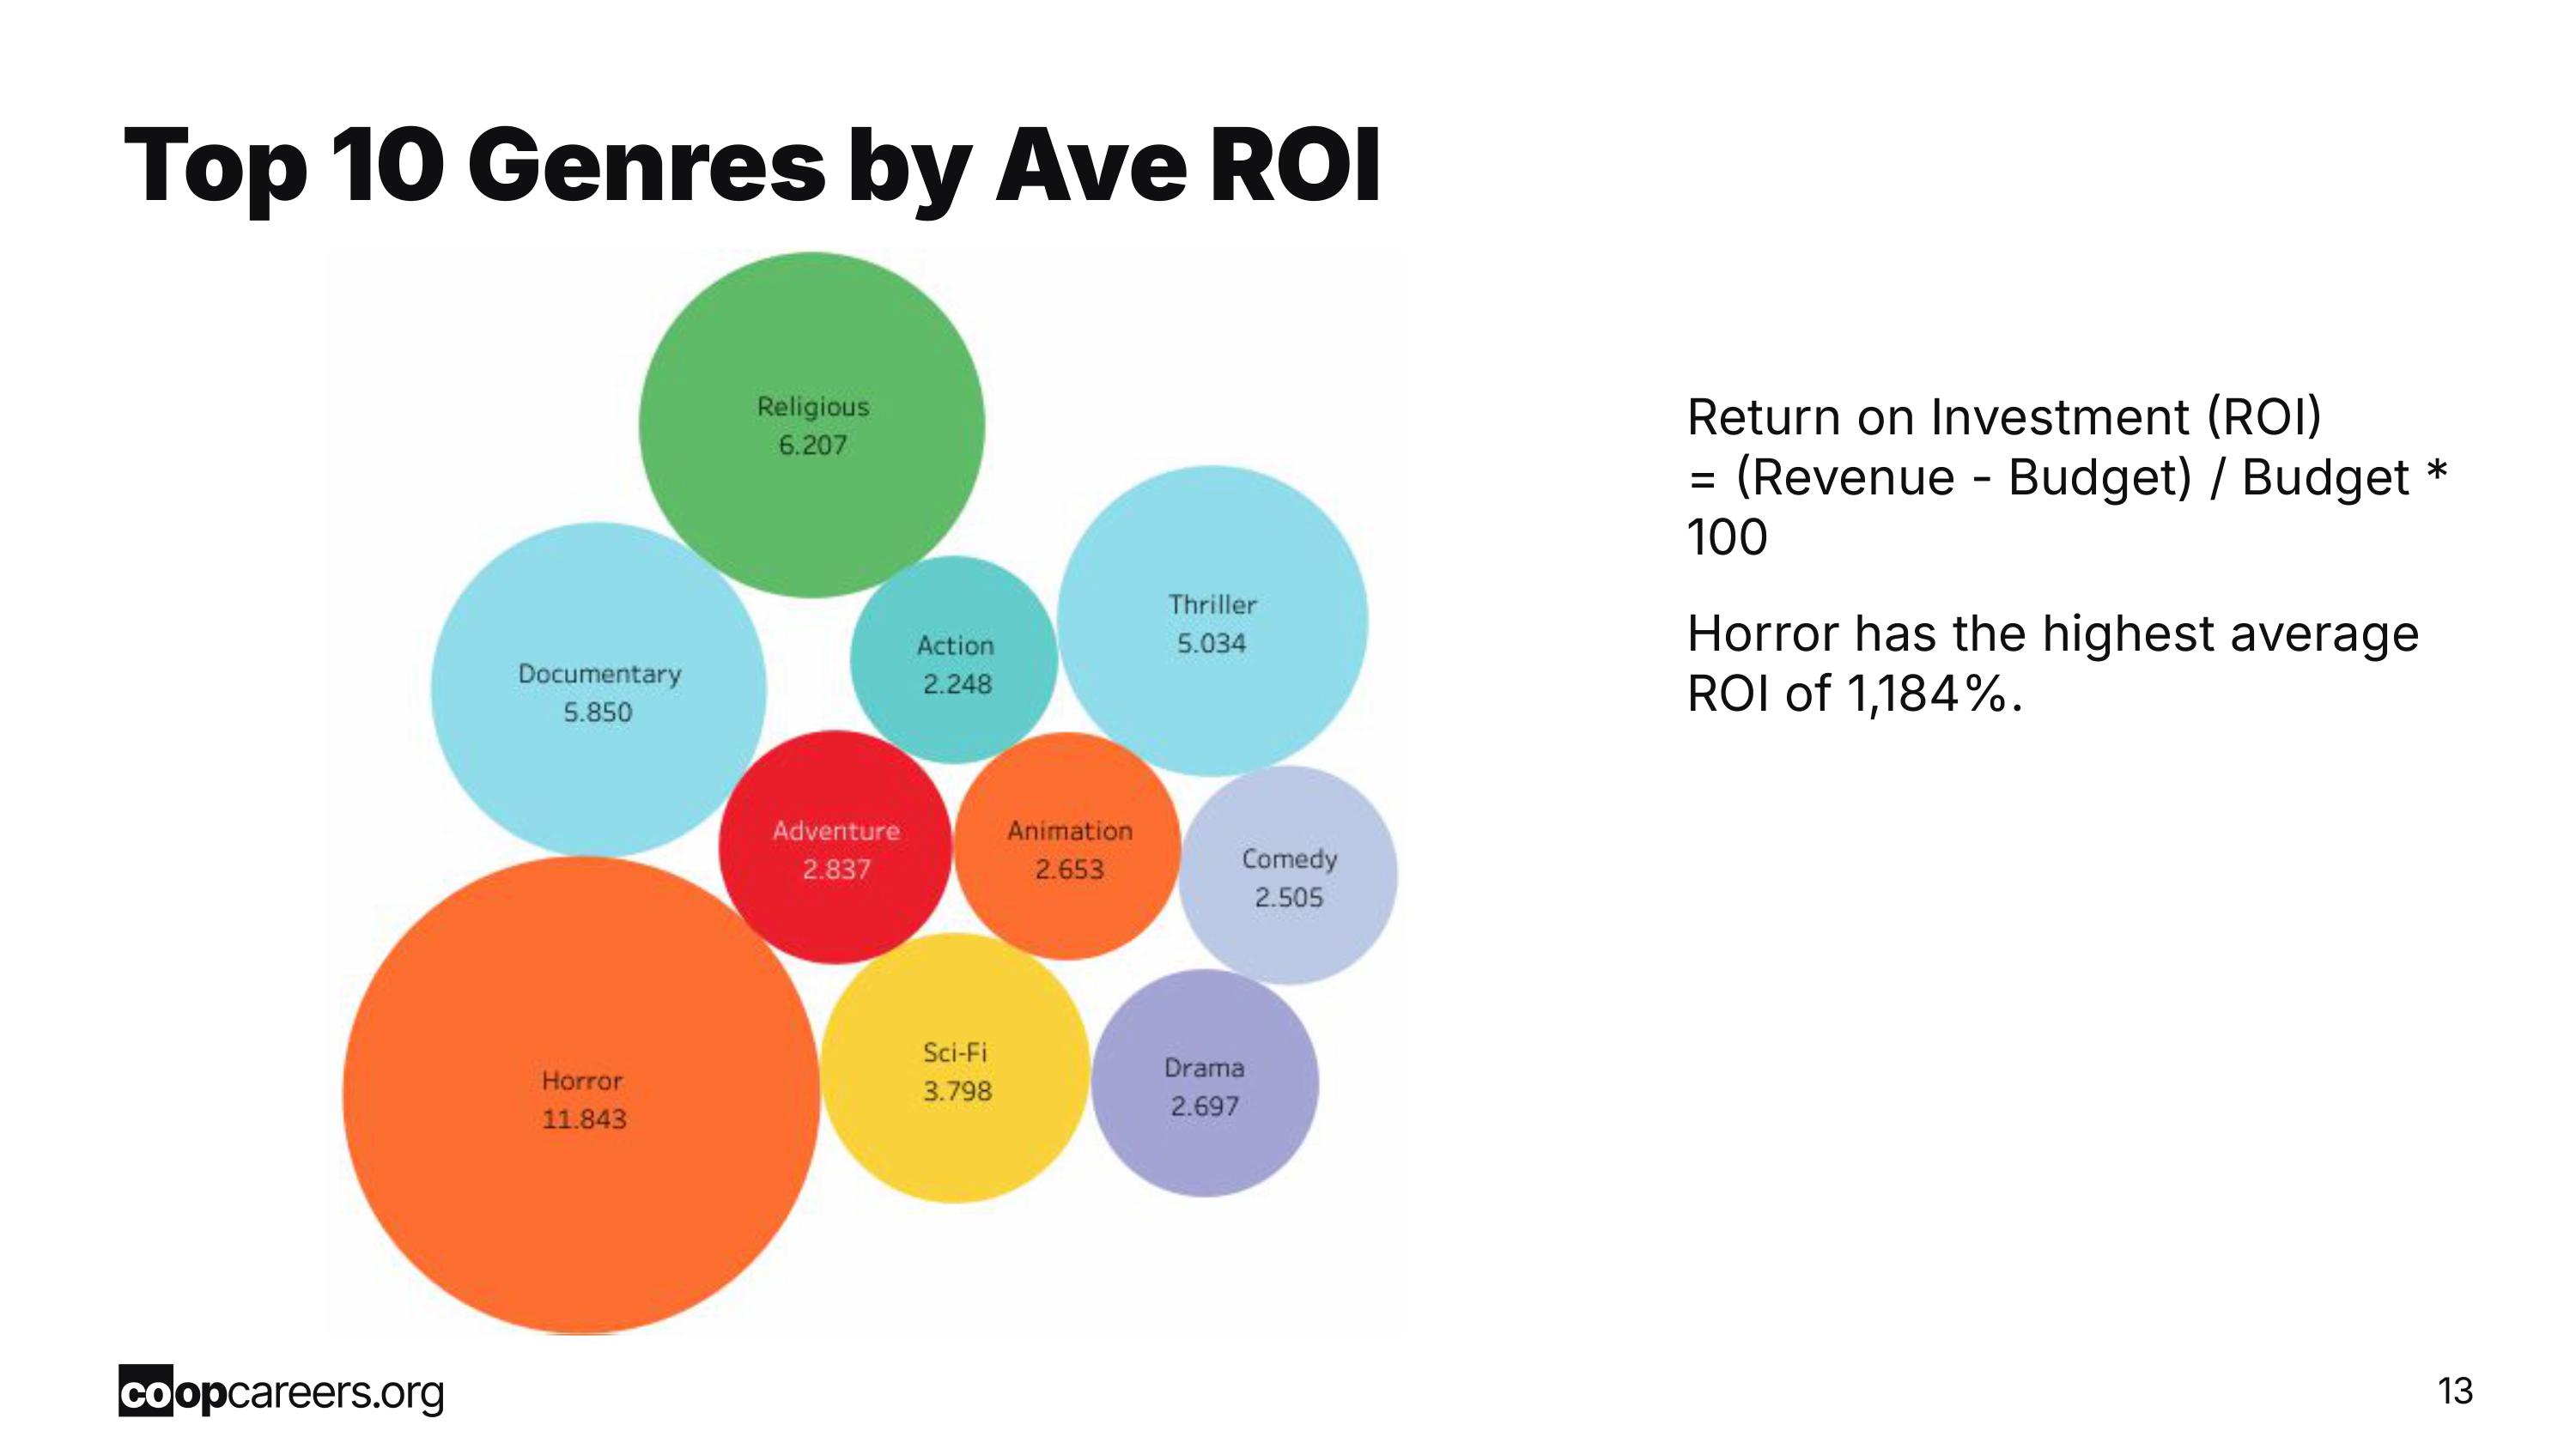
- Horror films have the highest return on investment out of all the film genres at 1,184%.
- Most films have their highest revenue release days on Mondays, Thursdays, and Saturdays.
- Revenue may increase by marketing with another movie in an opposite genre with the same premiere date.
Genre Recommendation:
The three genres with the highest ROI are horror, religious, and documentary, with 1,184%, 621%, and 585% respectively. A close fourth is the thriller genre with a 503% ROI, and thriller is one of the subgenres for some of the horror films in the dataset. So, we highly recommend that A24 pursue the horror movie genre for the upcoming film.Director/Cast Recommendation:
The top four most lucrative actors/actresses by average return on investment who starred in horror films are the following: Suzan Crowley, Shelley Hennig, Annabelle Wallis, and Jonathan Sadowski. The top four horror film directors by average return on investment include the following: Levan Gabriadze, William Brent Bell, John R. Leonetti, and Bradley Parker. We recommend that the top actors/actresses listed above be featured in the next horror film, along with the director generating the highest average return on investment for horror films. Levan Gabriadze would be the best fit for the director role, with an average return on investment of $63.1 million.Marketing Recommendation:
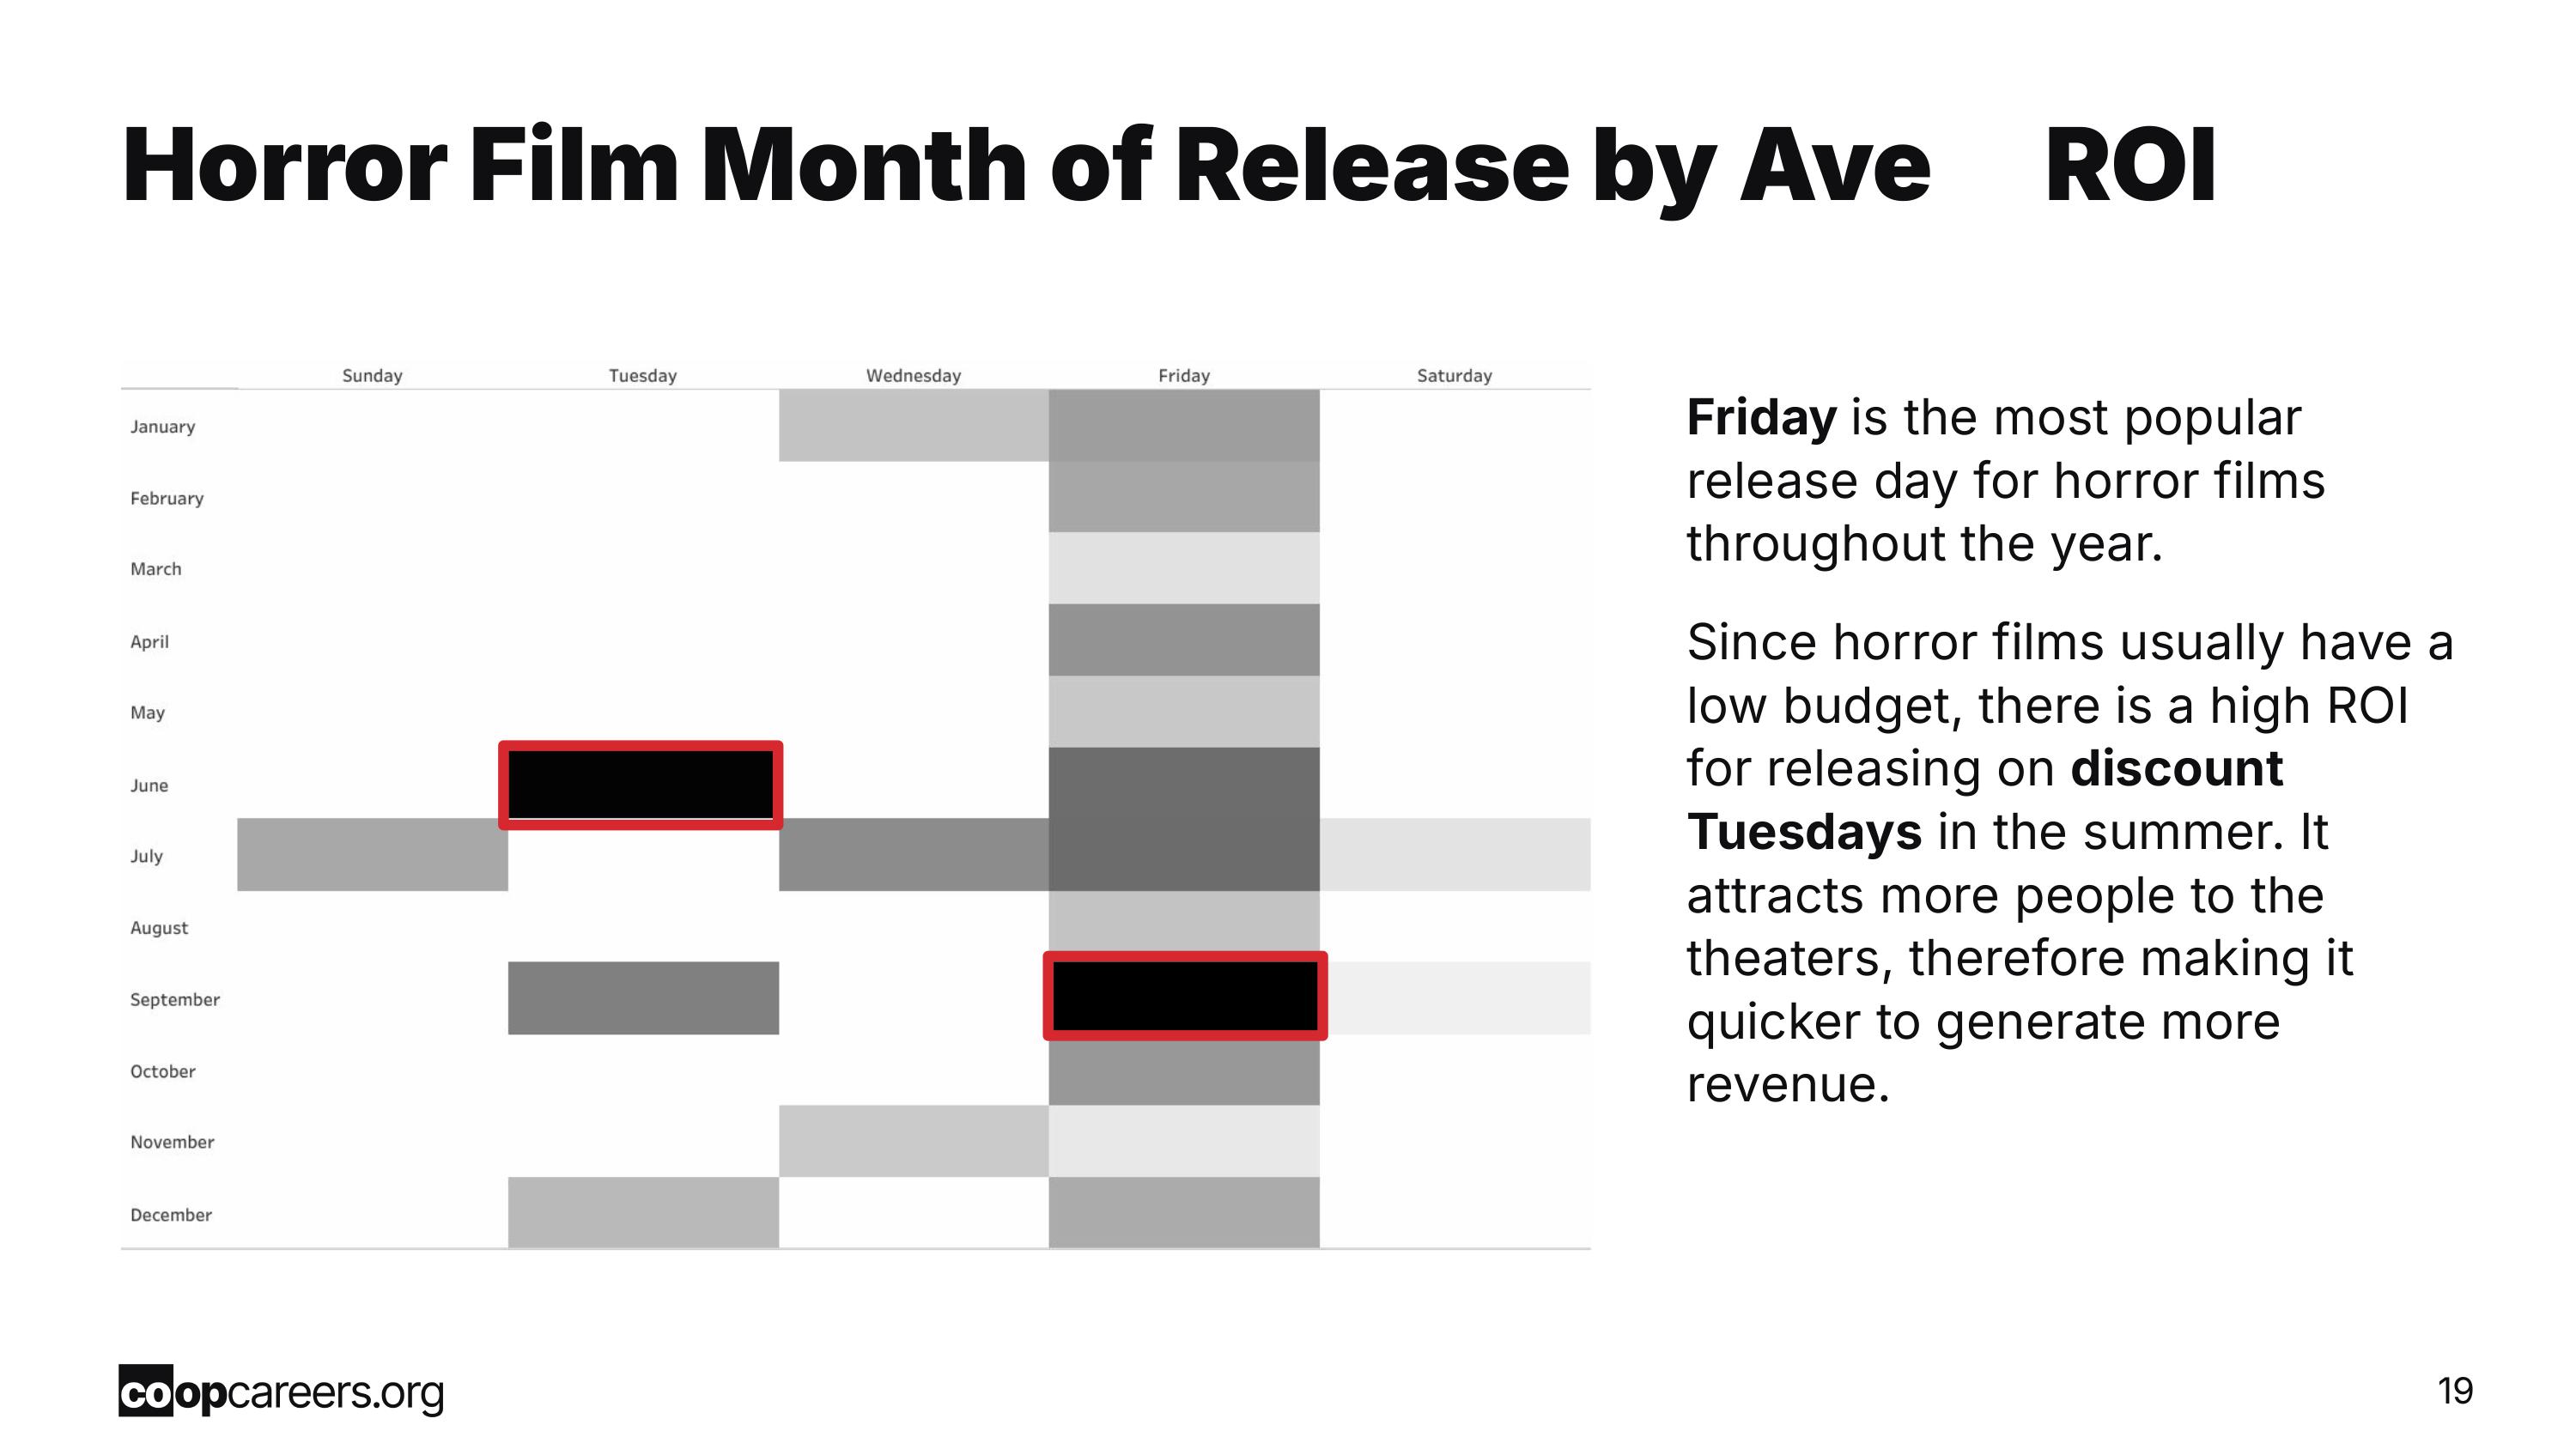
Regarding the timing of the release of A24’s next film, there are multiple factors to consider. The first is which season(s) in the year are the most profitable for horror films. According to the data, horror films with high ROI are released in the summer, at the start of fall, and around the holiday season. Summertime is a popular season for movie releases because moviegoers are usually on vacation. For horror, the beginning of fall is also a popular time because of the lead-up to Halloween. Lastly, it’s known that people tend to seek horror films around the holiday season to cope with the stress of gift-giving and hosting. Next, our analysis indicates that Friday is the most popular release day for all movies. While this could be a great option for a release day, there will be more competition. But with the proper marketing strategy, we can use this to our advantage. For example, in 2023, the Barbenheimer phenomenon was a huge success. Marketing two seemingly opposite films premiering on the same night generated so much buzz in the media and, ultimately, success for both films. Another day to consider is Tuesdays in the summertime. Theaters like AMC usually offer discounted tickets on Tuesdays. Since A24’s next film has a low budget, this would be an easy way to get more people to the movie theaters. Therefore, boosting the film’s ROI.Superstore Dashboard
Fellowship Assignment
︎︎︎Tableau
KRYSTN RILLORAZA
![]()
ABOUT
Currently, she’s a Data Analytics Instructor at COOP and a Development Analyst at a non-profit in Illinois. She optimizes fundraising strategy through donor data analysis and financial reporting. Her approach to data is grounded in years of user-focused design and analytical thinking. She studies how people move, think, and experience the world, and uses that understanding to build tools, strategies, and stories that are intuitive, elegant, and insight-driven.
Currently, she’s a Data Analytics Instructor at COOP and a Development Analyst at a non-profit in Illinois. She optimizes fundraising strategy through donor data analysis and financial reporting. Her approach to data is grounded in years of user-focused design and analytical thinking. She studies how people move, think, and experience the world, and uses that understanding to build tools, strategies, and stories that are intuitive, elegant, and insight-driven.